Analysis
Main acceleration/velocity overview
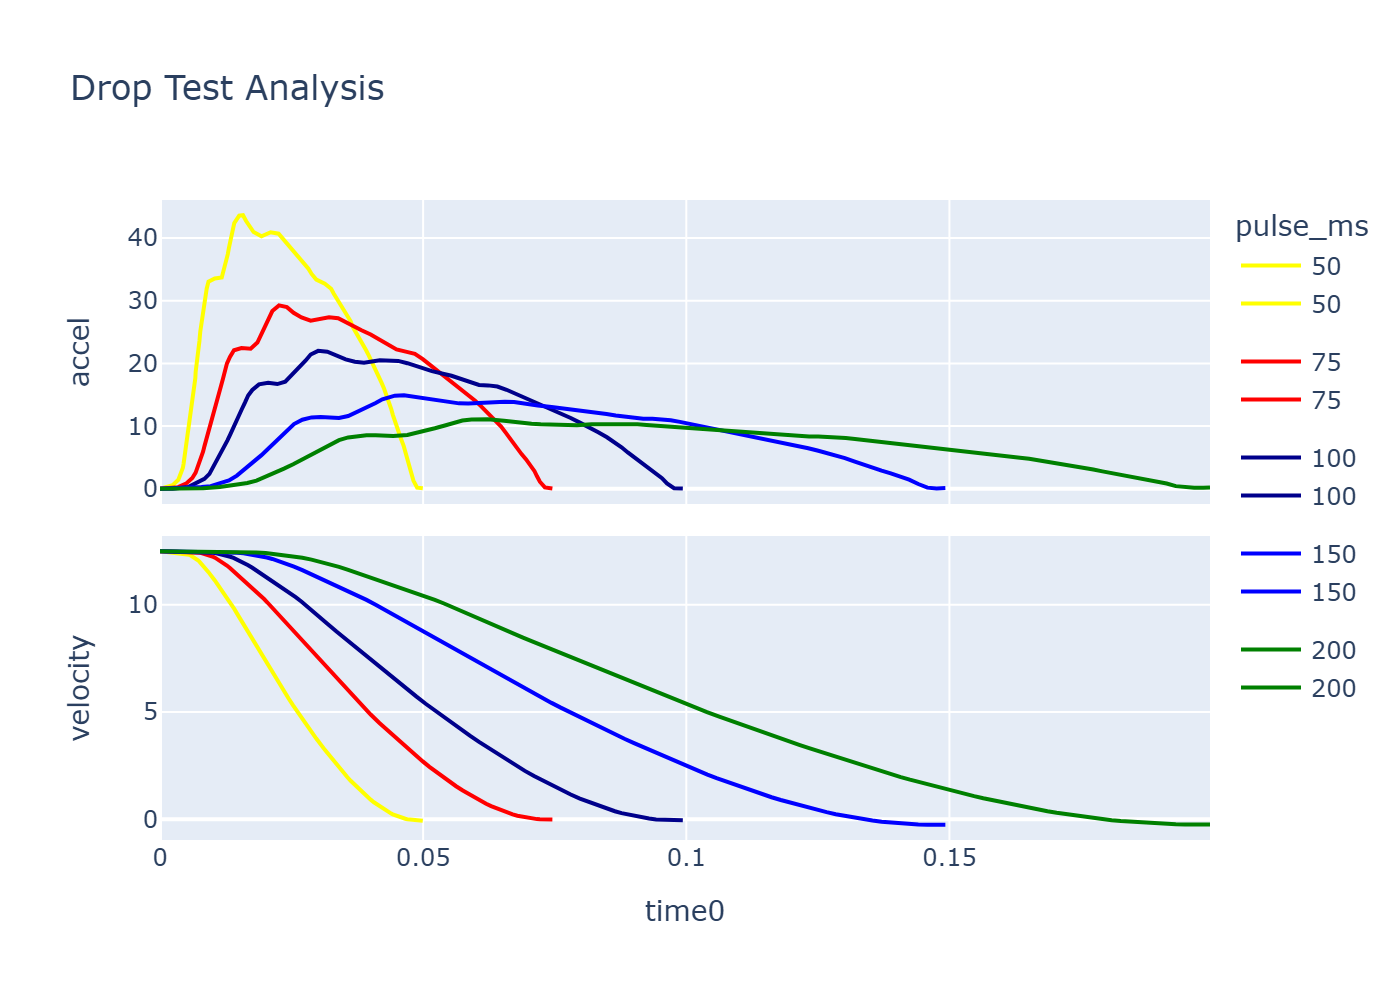
Figure 1 - Drop Test Analysis (click to open interactive chart).
General metrics
Data extracted from the research paper
| pulse_ms | Spine compression force_kN | injury_risk | |
|---|---|---|---|
| yellow | 50 | 7.64 | 0.625 |
| red | 75 | 6.20 | 0.233 |
| darkblue | 100 | 5.28 | 0.063 |
| blue | 150 | 4.22 | 0.004 |
| green | 200 | 3.30 | 0.000 |
Data computed from the curves
| yellow | red | darkblue | blue | green | |
|---|---|---|---|---|---|
| drop name | 50ms/yellow | 75ms/red | 100ms/dark-blue | 150ms/blue | 200ms/green |
| max acceleration (g) | 43.65 | 29.26 | 22.0 | 14.93 | 11.15 |
| SIC | 39.78 | 26.61 | 20.07 | 13.79 | 10.27 |
| DRI | 42.1 | 34.68 | 28.18 | 19.9 | 14.66 |
| first peak DRI xmax (mm) | 147.549 | 121.525 | 98.758 | 69.732 | 51.381 |
| EN theoritical drop momentum (kg·m/s) | 280.0 | 280.0 | 280.0 | 280.0 | 280.0 |
| measured momentum (kg·m/s) | 628.63 | 625.85 | 627.59 | 638.04 | 637.48 |
| extra momentum (%) | 124.51 | 123.52 | 124.14 | 127.87 | 127.67 |
| first peak max travel (mm) | 294.938 | 447.482 | 594.195 | 876.278 | 1170.737 |
| EN theoritical drop energy (J) | 812.25 | 812.25 | 812.25 | 812.25 | 812.25 |
| measured absorbed energy (J) | 3870.68 | 3905.7 | 3906.83 | 3907.9 | 3907.83 |
| extra energy (%) | -0.91 | -0.01 | 0.01 | 0.04 | 0.04 |
| duration above 38 g (ms) | 12.18343 | 0.0 | 0.0 | 0.0 | 0.0 |
| duration above 20 g (ms) | 33.373993 | 38.296454 | 19.902169 | 0.0 | 0.0 |
| pulse duration (ms) | 50 | 75 | 100 | 150 | 200 |
| Spine compression force (kN) | 7.64 | 6.2 | 5.28 | 4.22 | 3.3 |
| injury risk | 0.625 | 0.233 | 0.063 | 0.004 | 0.0 |
Notes on results
- The measured momentum is significantly higher (~620 kg·m/s) than the usual EN drop test (~270 kg·m/s). Assuming a falling mass of 50 kg, this corresponds to an impact velocity of ~12.4 m/s instead of ~5.7 m/s for EN tests.
- The SIC results are computed with exponent p = 2.0 over the 1-200 ms window.
Correlation with spine compression force
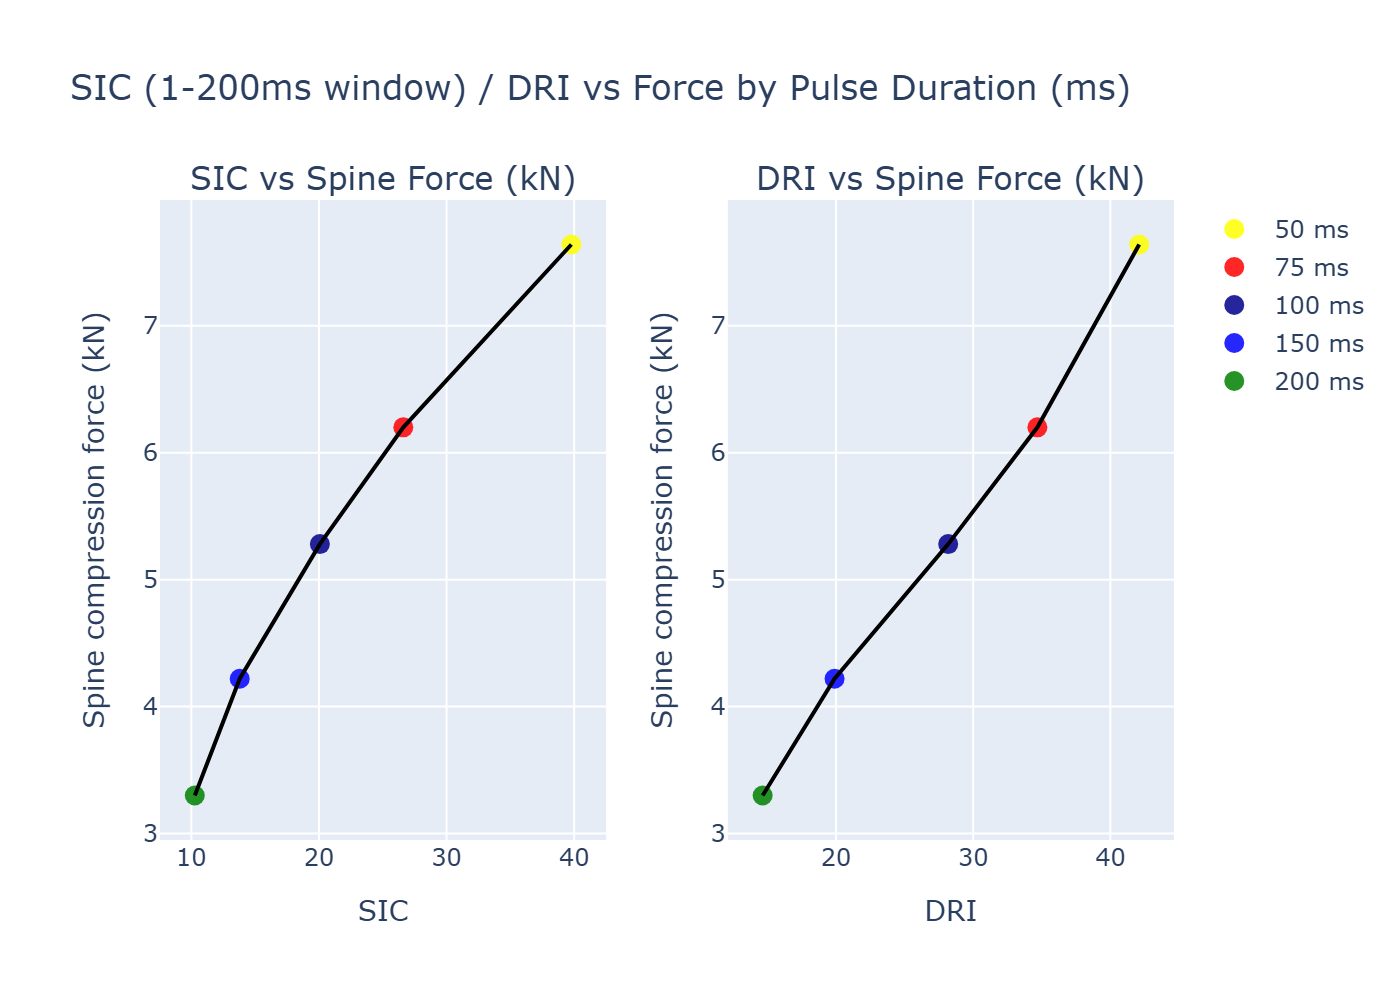
Figure 2 - SIC (1-200 ms) and DRI vs Force by pulse duration (click for interactive).
Correlation with injury risk
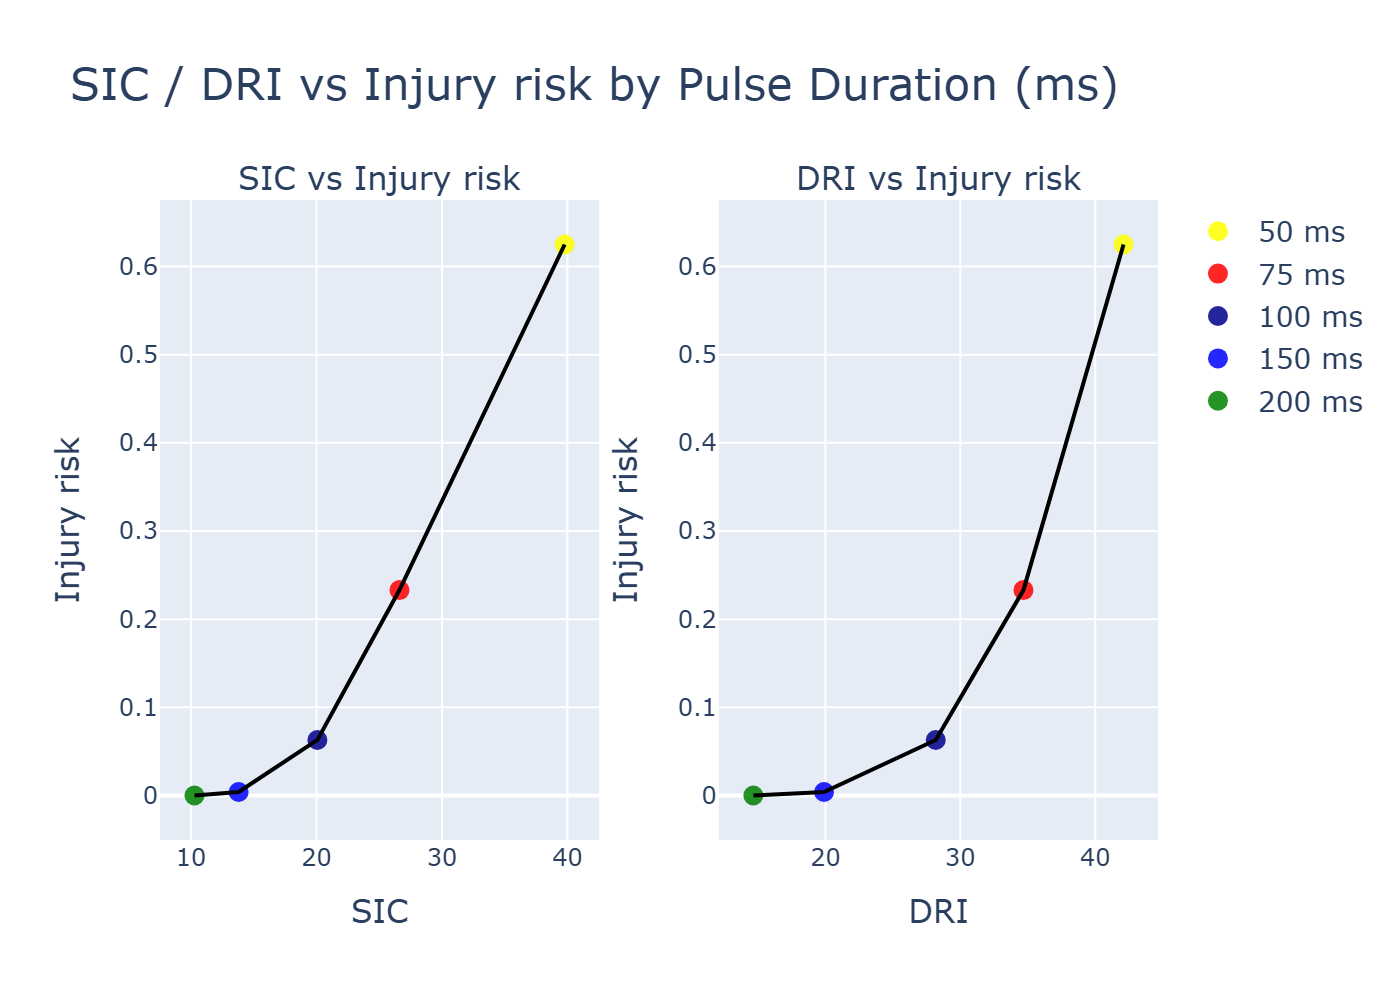
Figure 3 - SIC and DRI vs Injury risk by pulse duration (click for interactive).
SIC exponent influence
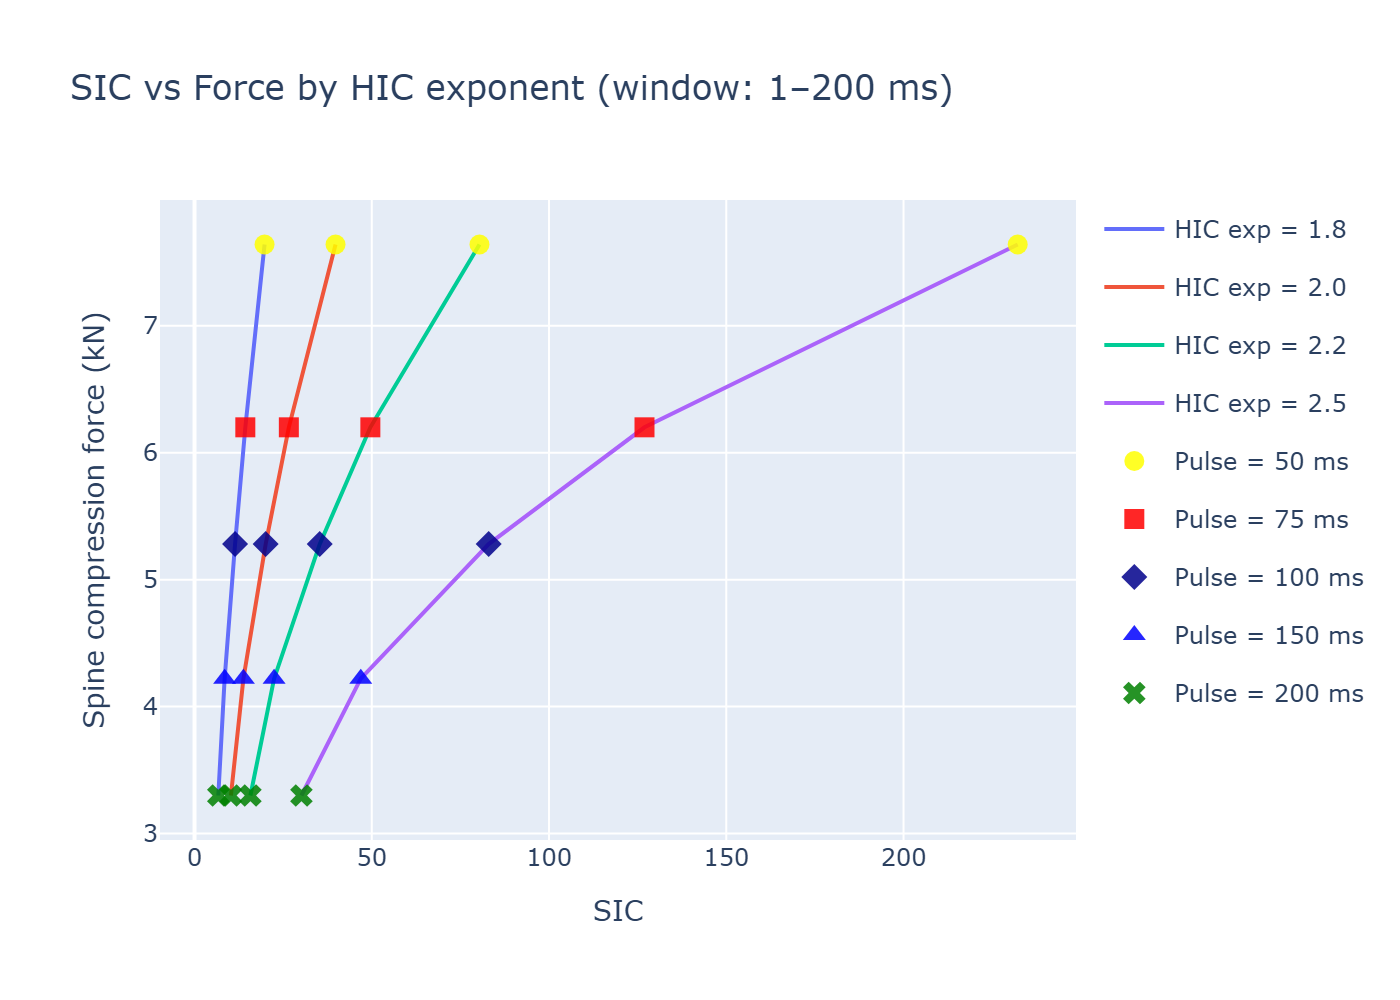
Figure 4 - SIC vs spine compression force by HIC exponent (1-200 ms window). Click to
open interactive
chart.
Eiband space
The idea is to plot these pulses inside the Eiband space.
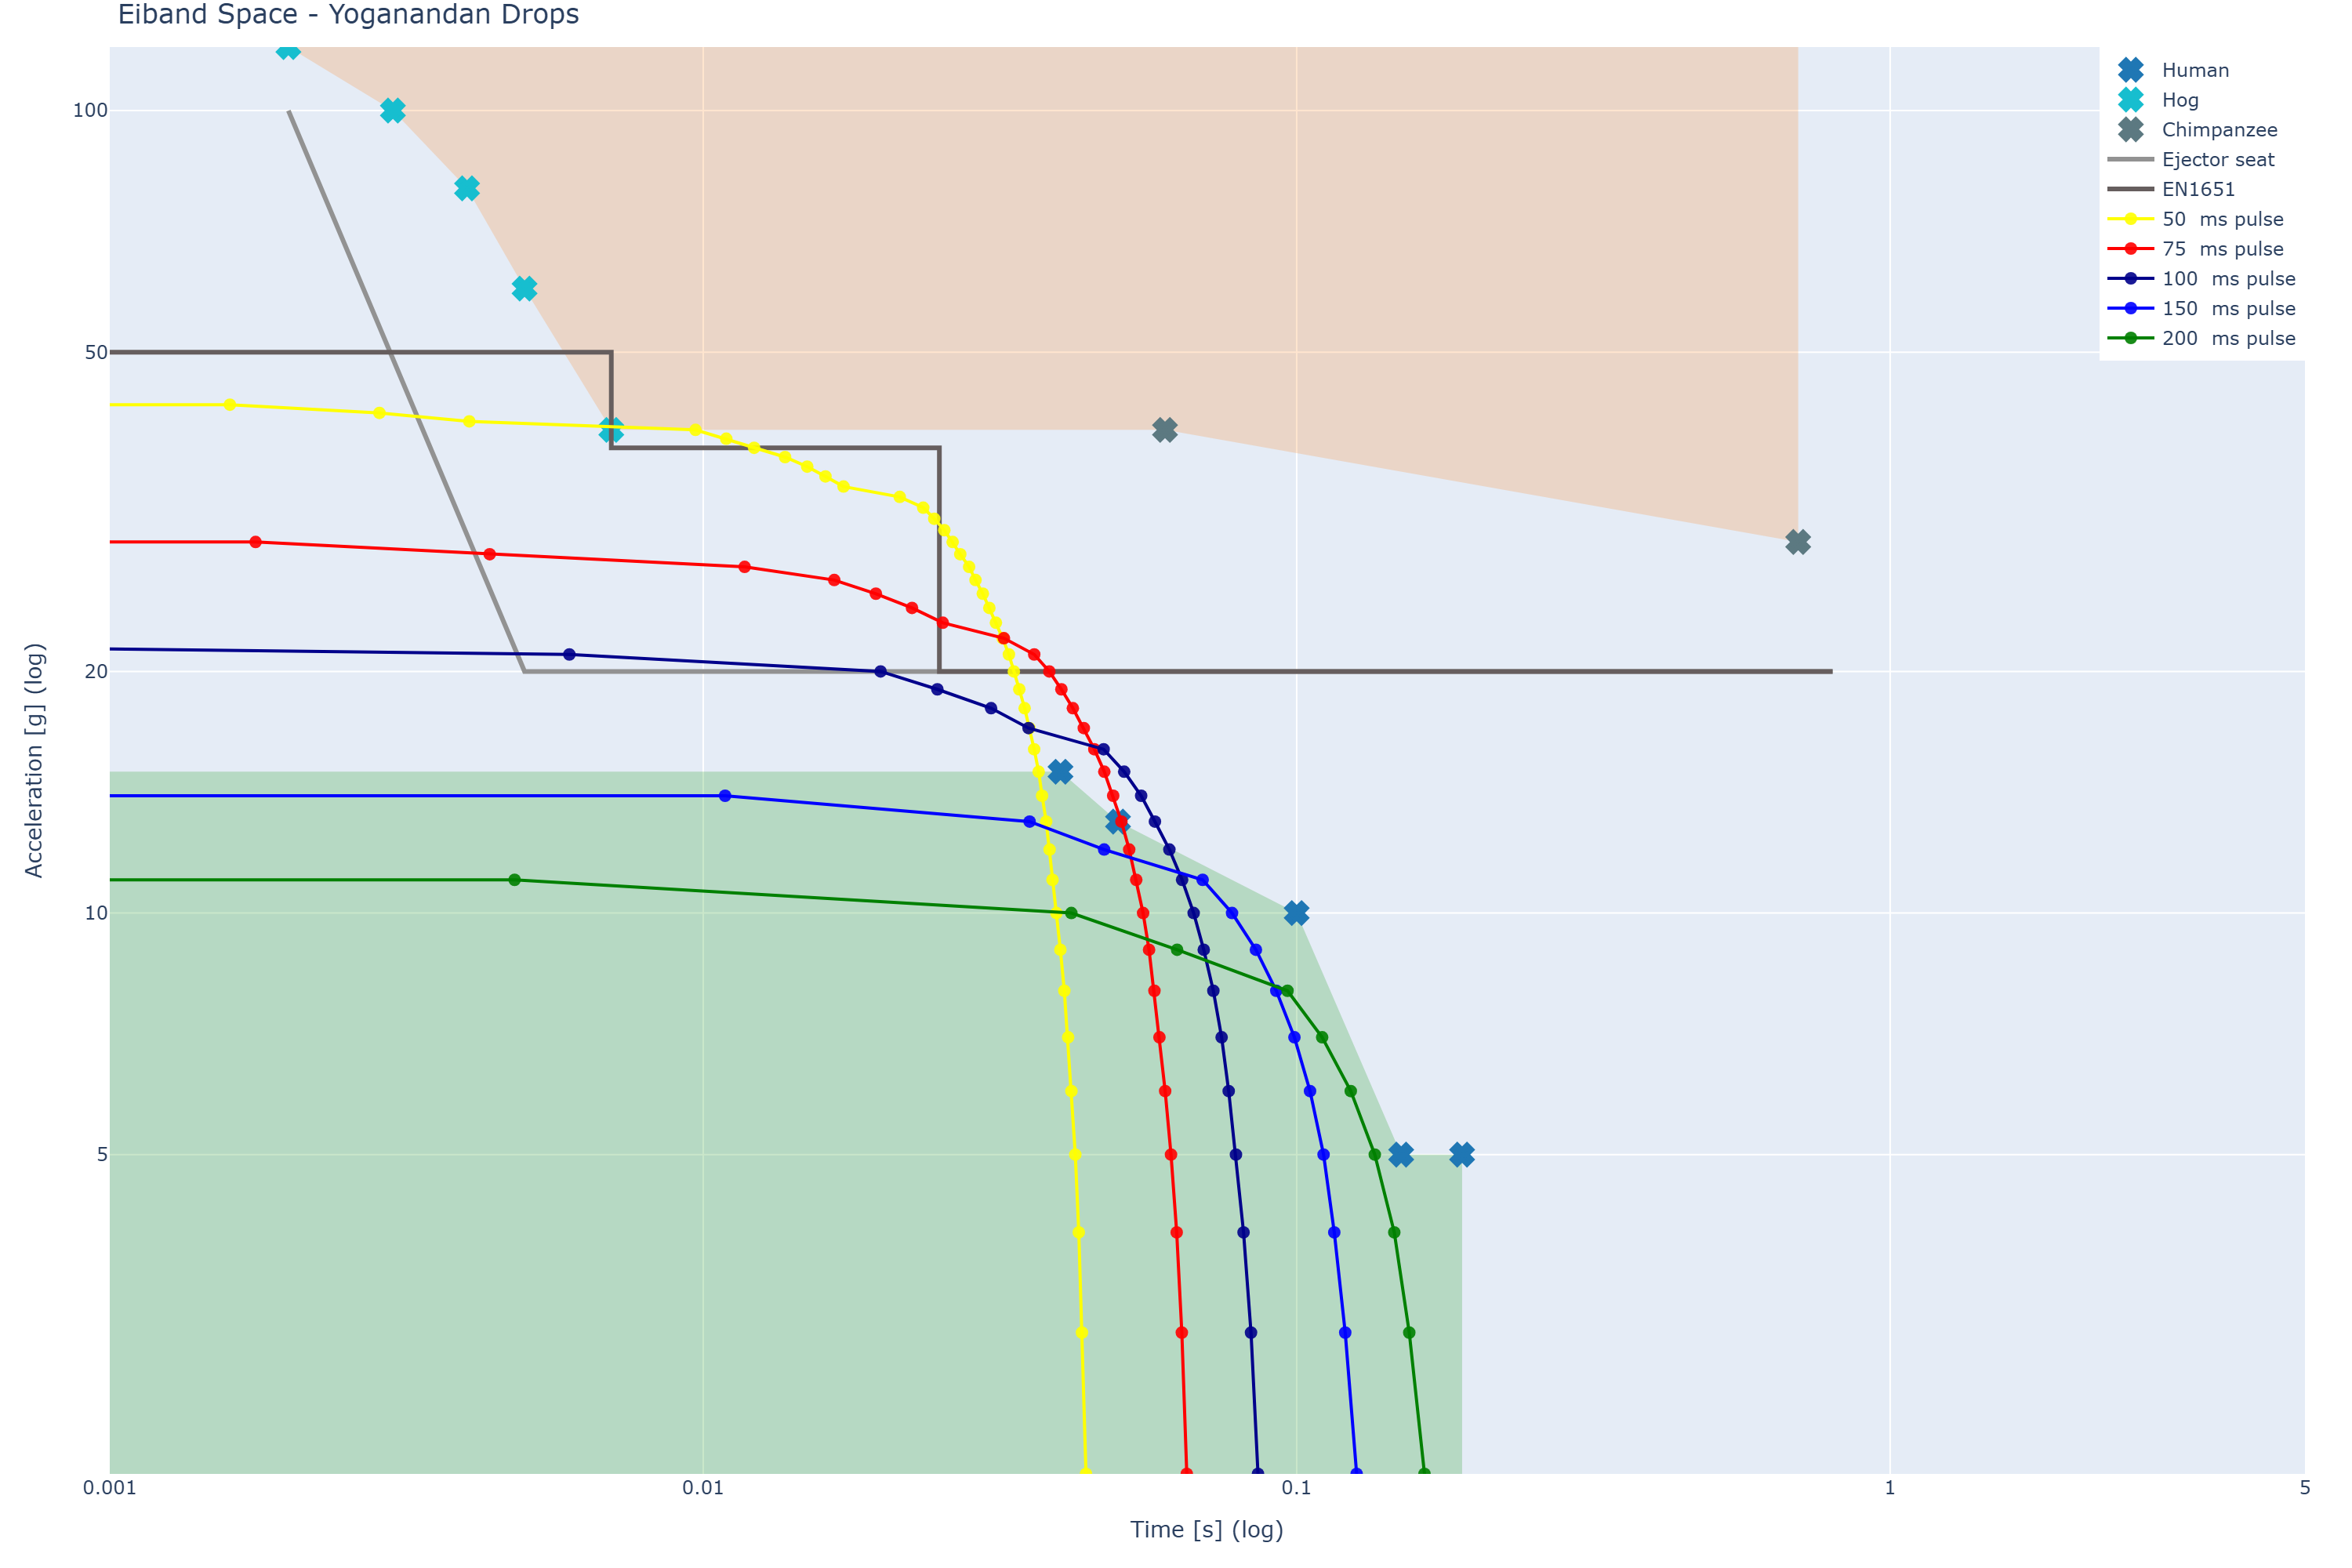
Figure 5 - Eiband Space - Yoganandan Drops (click for interactive).