Fred Pieri, V1 - 11/12/2025 Edit: 12/11/2025 , typo Edit: 30/12/2025 , add raw data for small drop on concrete
All the information below is my view and my understanding as of today. I allow myself to update my
position at any time based on new evidence, information, or facts.
You are a volunteer in an experiment to improve a paragliding impact pad. Thanks for your participation.
You will be subjected to a shock (vertical along your spine axis), and you can choose between two different
shocks:
Shock_A: Max acceleration: 57g, jerk: 5100 g/s
Shock_B: Max acceleration: 41g, jerk: 1000 g/s
Assuming you are concerned about your spine, and do not want to damage yourself, which shock do you choose?
...
You choose Shock_B. Of course, all values are lower.
Now let’s look more closely.
Shock_A details
I personally exposed myself to Shock_A. Here is the video; I suffered no damage.
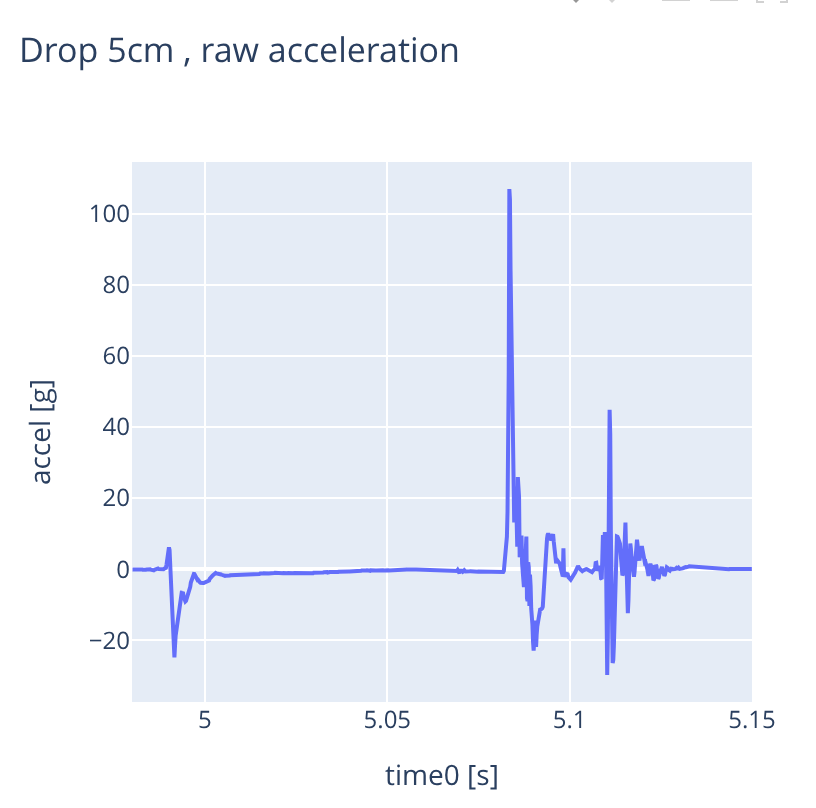
Details: 5–6 cm drop without any protection on a concrete floor.
The accelerometer was stuck to the seat plate.
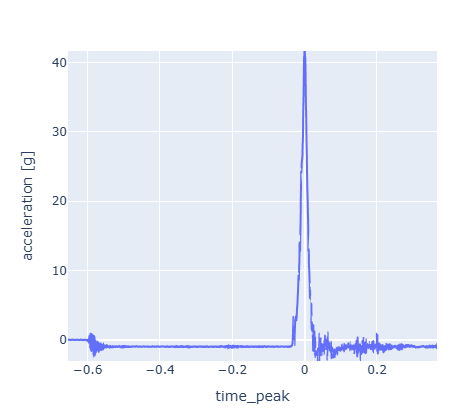
Raw data show a max g around 100g , the 57g announced was after slight filtering.
Here is the raw data, compatible with Zolt’s calculator.
Download CSV
Here the graph of the acceleration:
Shock_B details
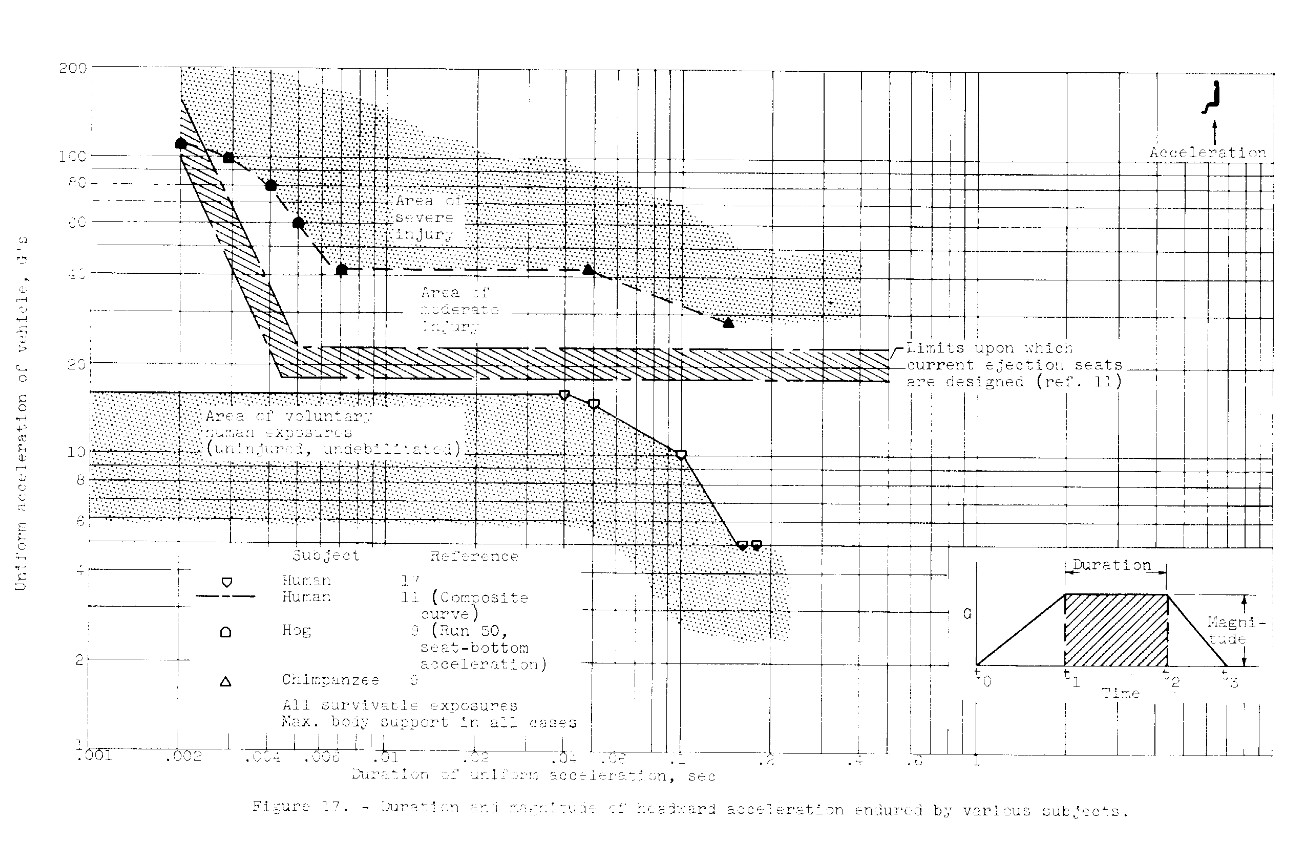
This is extracted from this study which is a major piece of reference.
Eiband, A. Martin (1959). Human Tolerance to Rapidly Applied Accelerations: A Summary of the Literature.
NASA Memorandum, NASA Lewis Research Center, Cleveland, OH, USA.
This shock was imposed on a chimpanzee in the Eiban study. The animal was severely injured.
This graph is a restoration of the original graph no. 17 of the Eiband study
(click to see the original).
Here is how moderate and severe injuries were defined in the context of this study:
Moderate injury includes slight injury of extremities, short-time unconsciousness,
dislocation, and simple spine fractures.
Severe injury includes life-threatening injuries such as severe hemorrhages, spine
injury,
abdominal and thoracic injury, multiple fractures,
concussion, and long-time unconsciousness.
Clearly Shock_A is safer.
What crucial information was missing when you chose the “safer” drop?
Answer: Time
More specifically: duration. The main difference between my drop and the chimpanzee in the
Eiban study is the
duration:
I was exposed to about 40g for 1 ms.
The chimpanzee was exposed to about 40g for 50 ms.
This makes a huge difference.
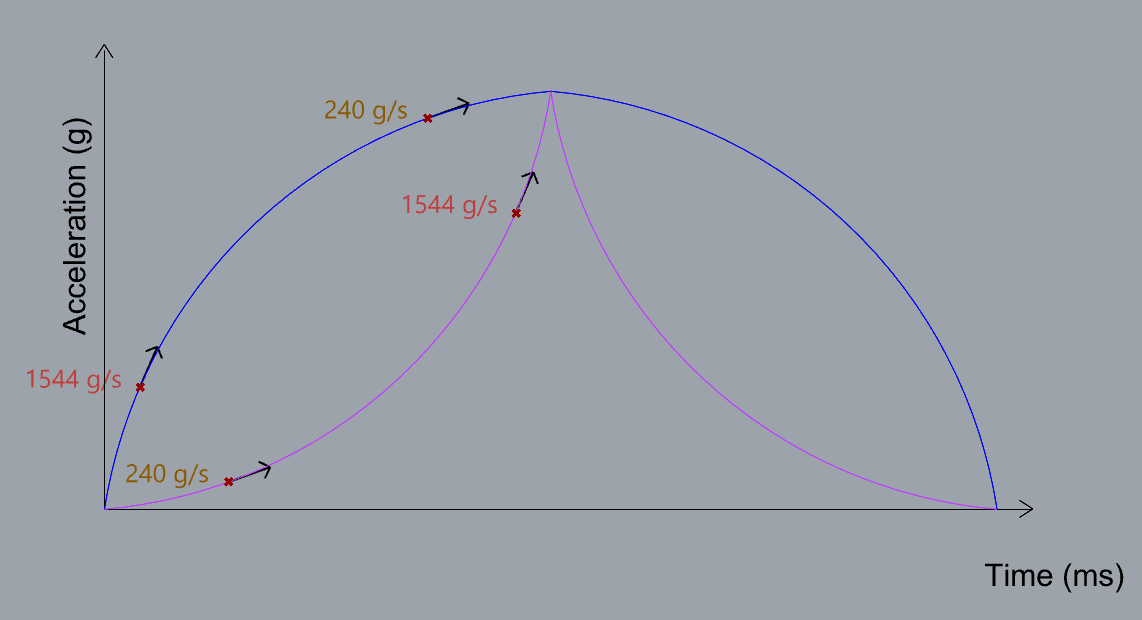
Another way to illustrate this is to imagine a given impact and then reduce all the durations by a factor of 2.
At the end of the animation, ask yourself: which shock looks safer?
As we reduce the duration of the impact, the jerk increases.
The purple drop is the same as the
blue one, but with all time scales shortened.
According to the Eiband study, we should prefer the
purple shock.
As at every G level, the time spent in the
purple shock is shorter than in the
blue shock.
From a physics point of view, shrinking the time is equivalent to reducing the shock energy.
This reinforces the point that time cannot be ignored when evaluating impact severity.
Concern about interpretation
It is relatively straight forward to define and apply limits on Jerk when we work with an
idealised linear acceleration profile.However, as soon as we consider a non-linear
acceleration profile,
the interpretation becomes much more complex.
In the graph above, the linear acceleration curve has a
constant jerk of 650 g/s.
For the non-linear acceleration curve, it is not possible to assign
a single, meaningful jerk value: jerk varies continuously over time.
This immediately leads to the idea of looking at jerk values over a
time window, for example: “average jerk over 5 ms”
or “peak jerk in a given interval.”
Discussing jerk over a duration essentially brings us back to a concept similar to
acceleration: a rate of change measured over time. In short, “jerk during a time window” becomes
another form of acceleration, raising the question of what additional insight it offers over
time-acceleration analysis.
Additional concern: at which G level does jerk matter?
Looking at these two curves, in both cases the maximum G is the same,
and the pilot is exposed to the same jerk values , just the order is reverse.
This raises a deeper question:
should we consider the G level at which a given jerk is applied?
In other words, does a jerk of 1000 g/s have the same effect at 10 g
as it does at 40 g?
I do not know the answer to this question, and I suspect it is highly technical and
depends on detailed biomechanical modelling of the spine and soft tissues. It is
another example of how jerk is difficult to interpret in a clear and practical way
for real-world impact protection.
Concern about mathematical complexity
Our acceleration signal is inherently noisy, and jerk is the
time derivative of that signal. This means that when we compute jerk,
the noise becomes much more prominent. I have already discussed this point int he previous document.
A common technical solution is to filter the signal before taking the derivative.
In practice, the processing chain often looks like this:
Raw acceleration signal → Low-pass filter → Derivative (jerk)
Each step adds extra parameters and choices, which significantly increases the complexity of the evaluation.
Method: we choose a Savitzky–Golay filter
(we could have used a simple finite difference, spline derivative, or other numerical method).
Polynomial order: we choose a 3rd-order polynomial
(we could have used order 2, 4, etc., which changes how “smooth” or “wiggly” the curve becomes).
Type of derivative: we choose the first derivative
(deriv = 1), which gives us jerk in units of G/s.
Time window: we choose a window of 15 ms
(a shorter window is more sensitive to noise, a longer window smooths more but hides details).
Each of these choices affects the final jerk signal and can change the result in a non-negligible way.
In total, these choices add 5 to 10 parameters that directly affect the final jerk signal.
Jerk becomes harder to interpret and very sensitive to the chosen processing chain, which is a poor basis
for clear, comparable, and repeatable metrics.
If this arbitrary choice simply shifts all values in the same direction, it is not a big problem,
because our comparisons are relative. But can we be sure there are no side effects?
Can we be sure we can find a set of parameters that does not favour one type of protection over another
without injuries reality?
Will the same settings behave the same way on all test rigs, with different instruments and sampling
frequencies?
We don't know if this given arbitrary choice of filter is going to result in a system that would classify
pertinently shock absorbtion devices.
Sensitivity of jerk to signal-processing choices
Here is an illustration based on a single EN drop on a classic moussebag protector:
The raw data for this drop can be downloaded (and used on Zolt’s website) :
here
Design of the sensitivity test
I perform a sensitivity test: I compute the maximum jerk value for different
combinations of four processing parameters (out of roughly ten possible ones):
Butterworth cutoff frequency (Hz)
Butterworth filter order
Savitzky–Golay polynomial order
Savitzky–Golay window size
The tested values are:
cutoff_list = [50.0, 100.0, 150.0, 200.0]   # Hz for Butter
order_list  = [1, 2, 3]                     # Butter order
window_list = [11, 21, 31]                  # samples, must be odd
poly_list   = [2, 3]                        # Savitzky–Golay polyorder
Correlation with maximum jerk
For each combination, I compute the maximum jerk and then look at the correlation
between that maximum jerk and each parameter. The correlation coefficients are:
Parameter
Correlation with max jerk
cutoff_hz
0.54
butter_order
0.24
savgol_window
-0.47
savgol_poly
0.46
From a statistical point of view, three parameters show a moderately strong
correlation with the maximum jerk, while butter_order shows a
weak to moderate correlation.
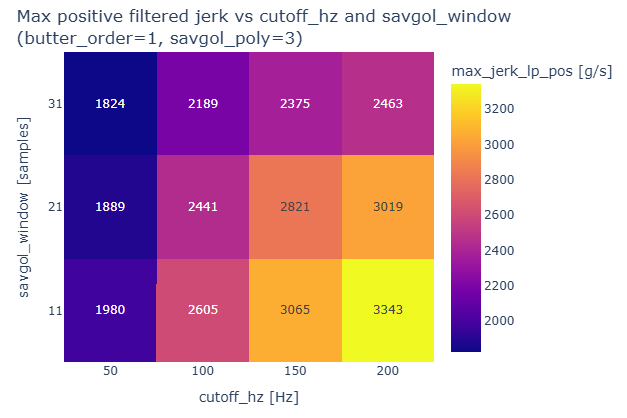
Visual impact of parameter choices
To give a visual impression of this effect, I fix:
butter_order = 1
savgol_poly = 3
and then look at how the maximum jerk changes when I vary only
cutoff_hz and savgol_window.
The resulting maximum jerk values range from about 1800 g/s to
3300 g/s purely because of changes in mathematical conventions
(filter and derivative settings).
And remember: this is for one single drop
only.
It highlights how sensitive jerk is to processing choices and how difficult it is to
use it as a robust, comparable metric.
My view on jerk
Jerk does not directly cause bone fracture.
Bone injury is driven by mechanical stress from forces, those forces are given by
F = m · a. Human tissues bring some damping this is why the duration as to be taken in
consideration as well. Because this loading is time-dependent, the
entire acceleration–time history matters; in a first-order description, the key variables for injury and
protection assessment are therefore the acceleration G and the
duration of high-g phases.
I agree that a lower jerk value is preferable only when the main loading parameters are the
same:
same peak acceleration (peak G) and same duration of the high-g phase. Once those are fixed, jerk becomes
a secondary descriptor of how quickly the load is applied and removed, and can help distinguish between
shocks with very similar acceleration–time histories. In paragliding, however, we are not yet at the point
of routinely comparing such fine details; we first need robust, consistent descriptions of impacts in
terms of G versus time.
My concerns about using jerk
Jerk alone is almost useless for the pilot. It must be accompanied by other
information,
especially the maximum G and the duration spent at different G levels. This extra complexity
makes it harder for users to understand and choose a protection.
Computation relies on arbitrary choices. Even if jerk is mathematically
computable, in practice it requires a lot of artificial or arbitrary decisions
(filtering, sampling, windowing, etc.), and these choices have a significant impact on the result.
It can be counter-productive. Pushing for a low jerk value tends to favor
longer impacts. A longer impact at a given G level increase the risk of injury.
My preferred approach
I clearly favor a time-based approach instead of focusing on jerk. At the moment,
two ideas look particularly promising:
Dynamic Response Index (DRI): a dimensionless value that estimates the risk of
spinal injury from a vertical shock load by calculating the maximum compression in a simplified
spine model (mass–spring–damper), whose motion is governed by a second-order ordinary
differential equation.
Spine injury Criterion (SIC): the approach currently being developed by WG6. It
integrates the acceleration
over time with weighting coefficients and can be directly linked to the Eiband study.
In the current EN system the pilot need to look at 3 values ( max_g + 2 durations) to really assess the
performance of his impact pad.
Both prefered approaches have the advantage of producing one unique meaningful outcome value which makes
them simpler for the pilot to compare the performance of different impact pads.
Side Discussion
An analogy for a second-order model
To get an intuitive feel for what a second-order model means, here is a simple analogy.
As usual, the analogy has its limits.
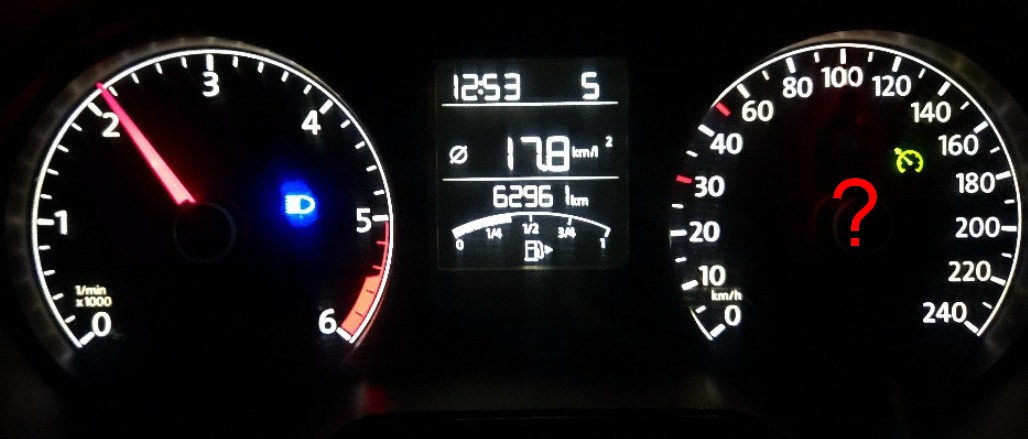
Imagine you are in a car and you only know the engine speed:
the tachometer shows 2200 RPM. Can you guess the vehicle speed?
We agree that, in general, higher RPM tends to mean higher speed.
But without knowing the current gear, any speed estimate based on RPM alone is useless.
knowing the current gear, my speed prediction will be better.
then of course if you give me both the gear position and the RPM,
I can estimate the speed much more precisely.
For me the G and duration are like the Gear information and the Jerk the RPM information.