Tests
Honeycomb Drop Height Comparison
Protocol
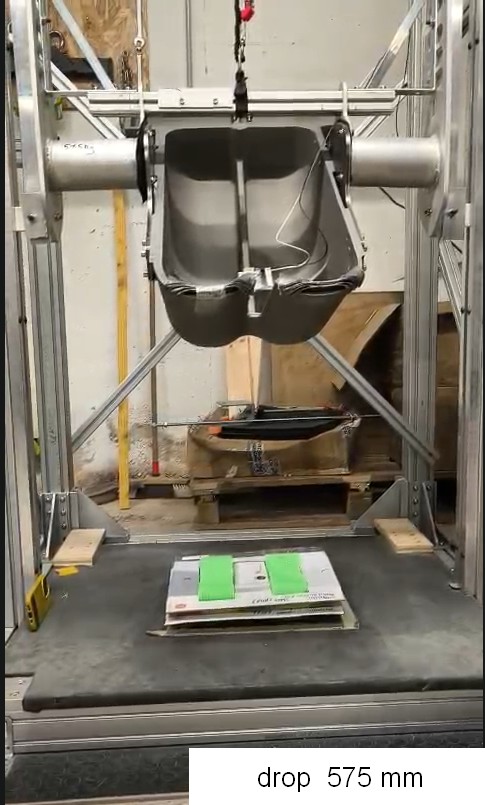
- The dummy is dropped naked on 2 blocks of Koroyd: length: 275 mm, width: 75mm, thickness: 75mm.
- The pair of blocks are held in place with a thin piece of cardboard, untouched by the dummy
- 2 pairs of blocks were used, one receiving multiple drops. Here is a table showing the drop details:
Drop Details Table
| Drop ID |
Block ID |
Drop Height (mm) |
Original Thickness (mm) |
Color |
Comment |
| 167 |
1 |
1650 |
75 |
grey |
new block |
| 169 |
2 |
275 |
75 |
orange |
First drop on this block |
| 170 |
2 |
575 |
75 |
green |
second drop on the same block |
| 171 |
2 |
878 |
75 |
red |
Third drop on the same block |
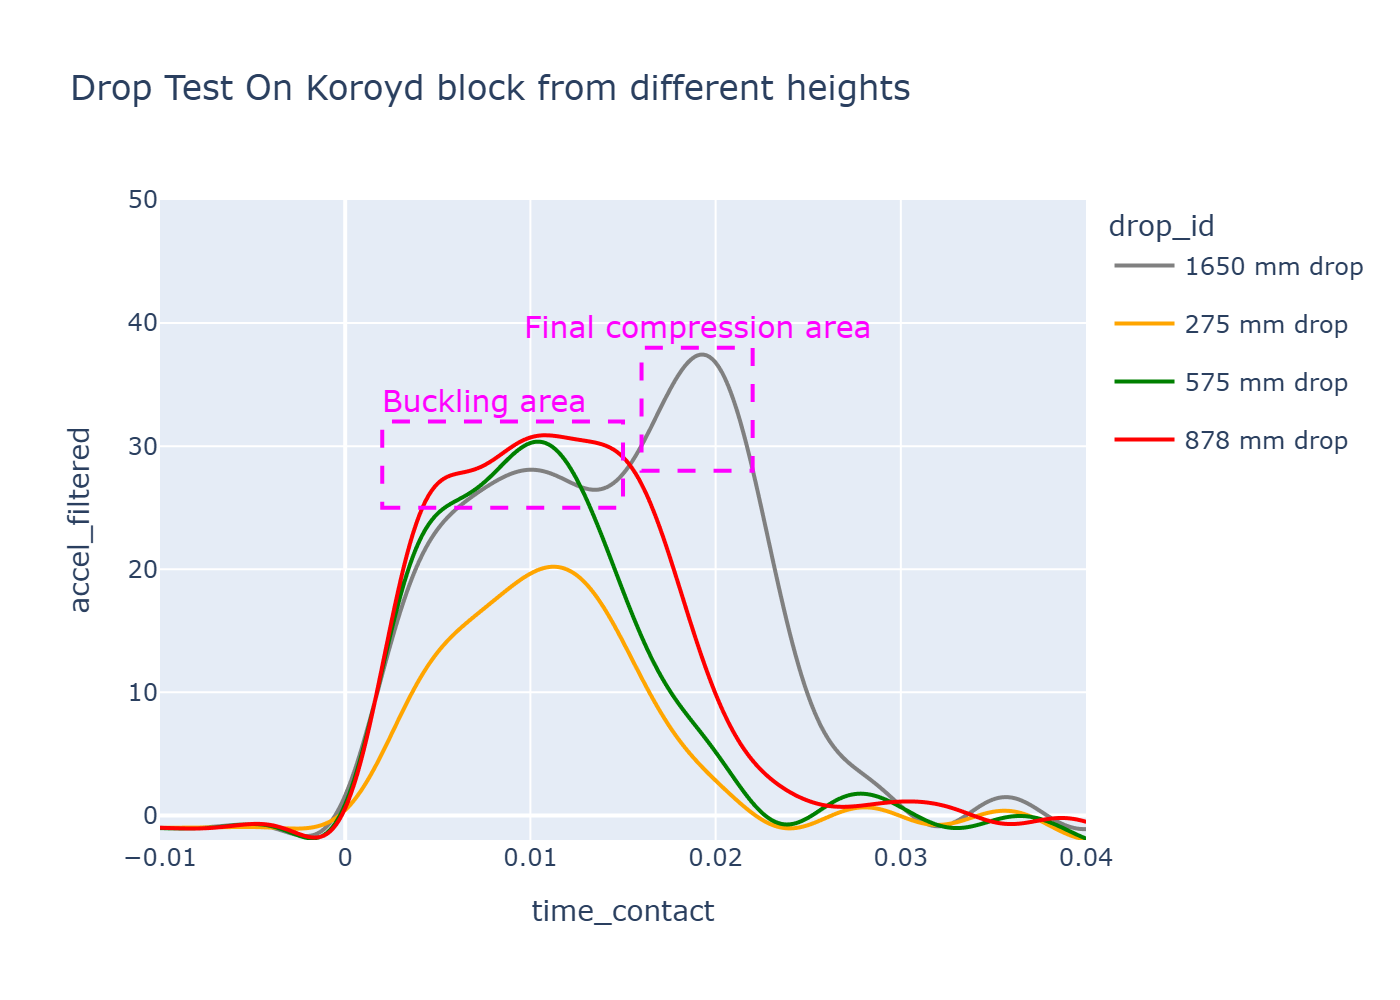
Acceleration Curves by Height
Analysis: Two Distinct Behaviors
There are 2 different behaviors observed:
- Buckling area: Offering a constant force, independently of the drop height. Small drops
and large drops show the same maximum g (between 28 and 32 g). What changes is the duration of this
plateau and the total buckled thickness.
- Final compression area: When the full height of the Koroyd is buckled, the dummy is
smashing a already buckled pile of plastic, which shows a completely different response.
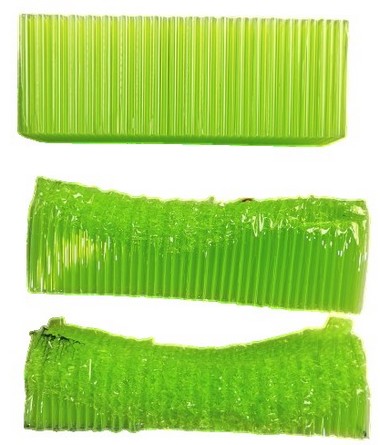
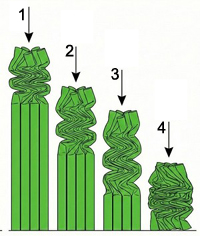
Illustrations of the 3 Possible Stage Types
- 1/ Intact
- 2/ Partially used: half of the top is buckled, the bottom part is intact. This
configuration offers a plateau response.
- 3/ Completely used: the full height has buckled. This configuration offers a final
compression response before bottoming out.
Notes
- The orange curve shows a different behavior. The drop was from 275 mm above the ground, which means 200
mm from first contact. We don't explain well why the Jerk is significantly smaller on this drop.
- Keep in mind that the drops at 275 mm (orange), 575 mm (green), and 878 mm (red) were performed on a
single pair of blocks so the intact parts of Koroyd were getting smaller and smaller.
Numerical output
|
0 |
1 |
2 |
3 |
| drop ID |
167 |
169 |
170 |
171 |
| drop name |
Koroyd / 1.650m / 75mm |
Koroyd / 0.275m / 75mm |
Koroyd / 0.575m / 75mm |
Koroyd / 0.878m / 75mm |
| Drop height (mm) |
1650 |
275 |
575 |
878 |
| falling mass (kg) |
52.0 |
52.0 |
52.0 |
52.0 |
| max acceleration - filtered (g) |
37.44 |
20.2 |
30.36 |
30.88 |
| SIC |
86.63 |
13.94 |
41.8 |
61.87 |
| DRI |
19.69 |
6.34 |
10.58 |
15.4 |
| DRI xmax (mm) |
69.0 |
22.23 |
37.068 |
53.981 |
| measured momentum (kg·m/s) |
329.67 |
128.21 |
203.09 |
253.01 |
| duration above 38 g (ms) |
0.07 |
0.0 |
0.0 |
0.0 |
| duration above 20 g (ms) |
19.35 |
1.325 |
12.44 |
15.10 |
| curve color |
grey |
orange |
green |
red |
Interpretation
The buckling theory behind this type of protector can be observed in practice:
Honeycomb Thickness Comparison
Protocol
- The dummy is dropped naked on 2 blocks of Koroyd: length: 275 mm, width: 75mm. The initial protector
thickness varies for
different measurements.
- The pair of blocks are held in place with a thin piece of cardboard, untouched by the dummy
Drop Details for Thickness
| Drop ID |
Block ID |
Drop Height (mm) |
Original Thickness (mm) |
Color |
Comment |
| 167 |
1 |
1650 |
75 |
grey |
new block |
| 168 |
3 |
1650 |
115 |
blue |
new block |
| 194 |
4 |
1650 |
60 |
brown |
new block |
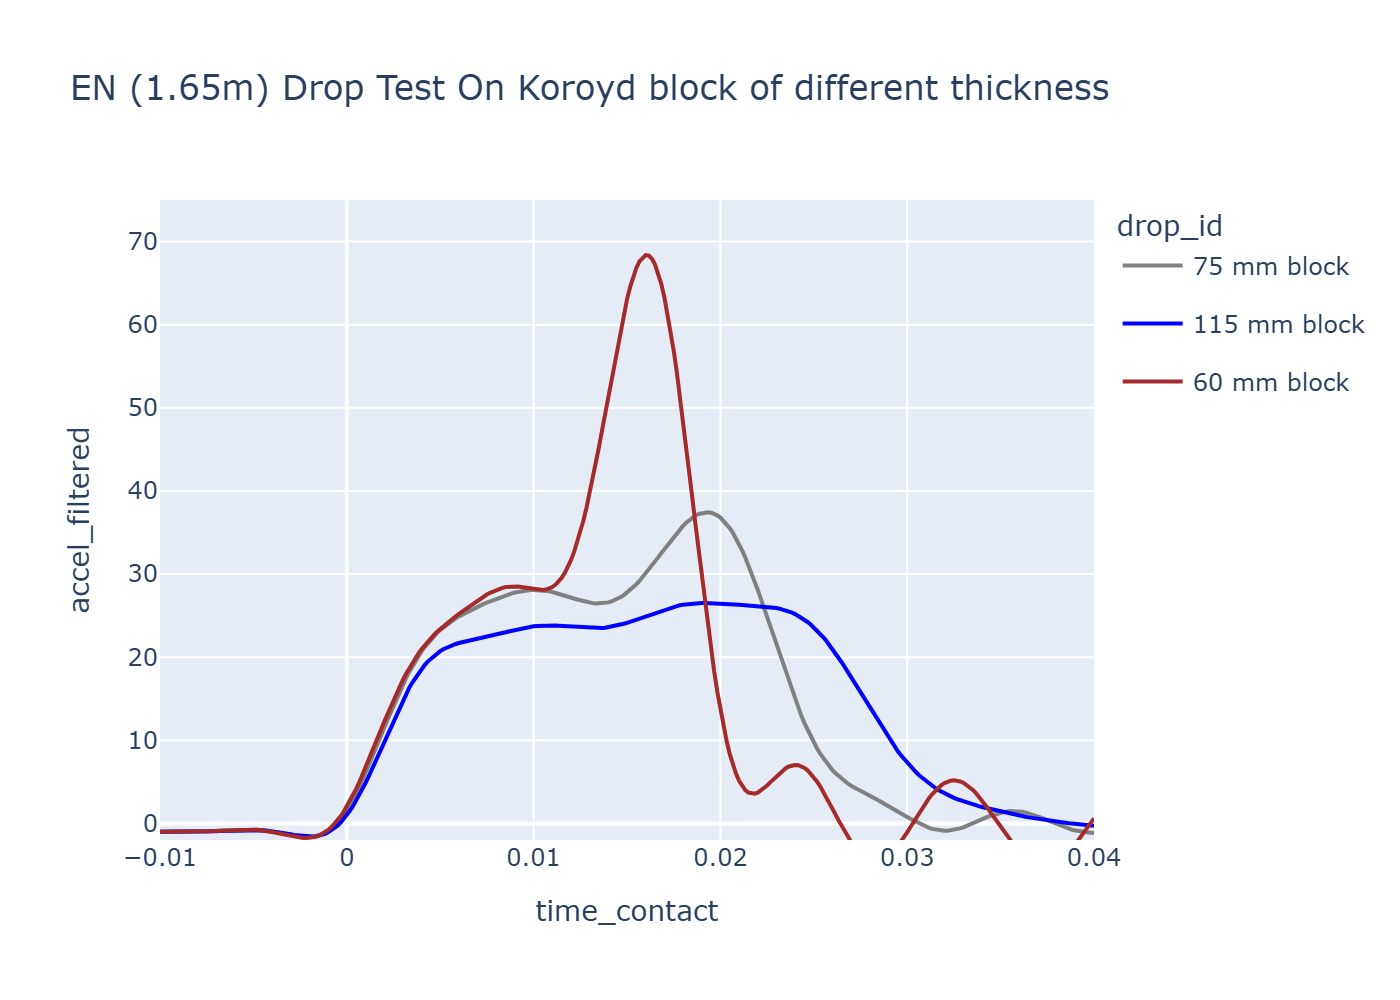
Acceleration Curves by Thickness
Analysis
- If the protector is not thick enough, the dummy touches the 'final compression' area and produces a
higher
max g.
Numerical results
|
0 |
1 |
2 |
| drop ID |
167 |
168 |
300 |
| Thickness (mm) |
75 mm |
112.5 mm |
60 mm |
| drop name |
Koroyd/1.65 m / 75 mm |
Koroyd/1.65 m / 112.5 mm |
Koroyd/1.65 m / 60 mm |
| Drop height (mm) |
1650 |
1650 |
1650 |
| falling mass (kg) |
52.0 |
52.0 |
52.0 |
| max acceleration - filtered (g) |
37.44 |
26.52 |
68.37 |
| SIC |
86.63 |
65.46 |
141.94 |
| DRI |
19.69 |
21.42 |
18.82 |
| DRI xmax (mm) |
69.0 |
75.06 |
65.96 |
| measured momentum (kg·m/s) |
329.67 |
328.61 |
349.16 |
| duration above 38 g (ms) |
0.07 |
0.0 |
5.35 |
| duration above 20 g (ms) |
19.35 |
21.11 |
15.27 |
| curve color |
grey |
blue |
brown |
Interpretation
- If used in big enough thickness, free of final plastic compression, the koroyd protector can maintain
very
low_g (<30g) during high energy impacts.
- The 60mm and 75mm protector shows poorer results in a 165 cm fall, not because of the technology itself
but
because thiers thickness is insufficient to not enter in the final compression stage.
- The 115 mm protector shows a maximum acceleration below 30 g. Comparable
performance at this thickness was not observed with any other non-destructive technologies.
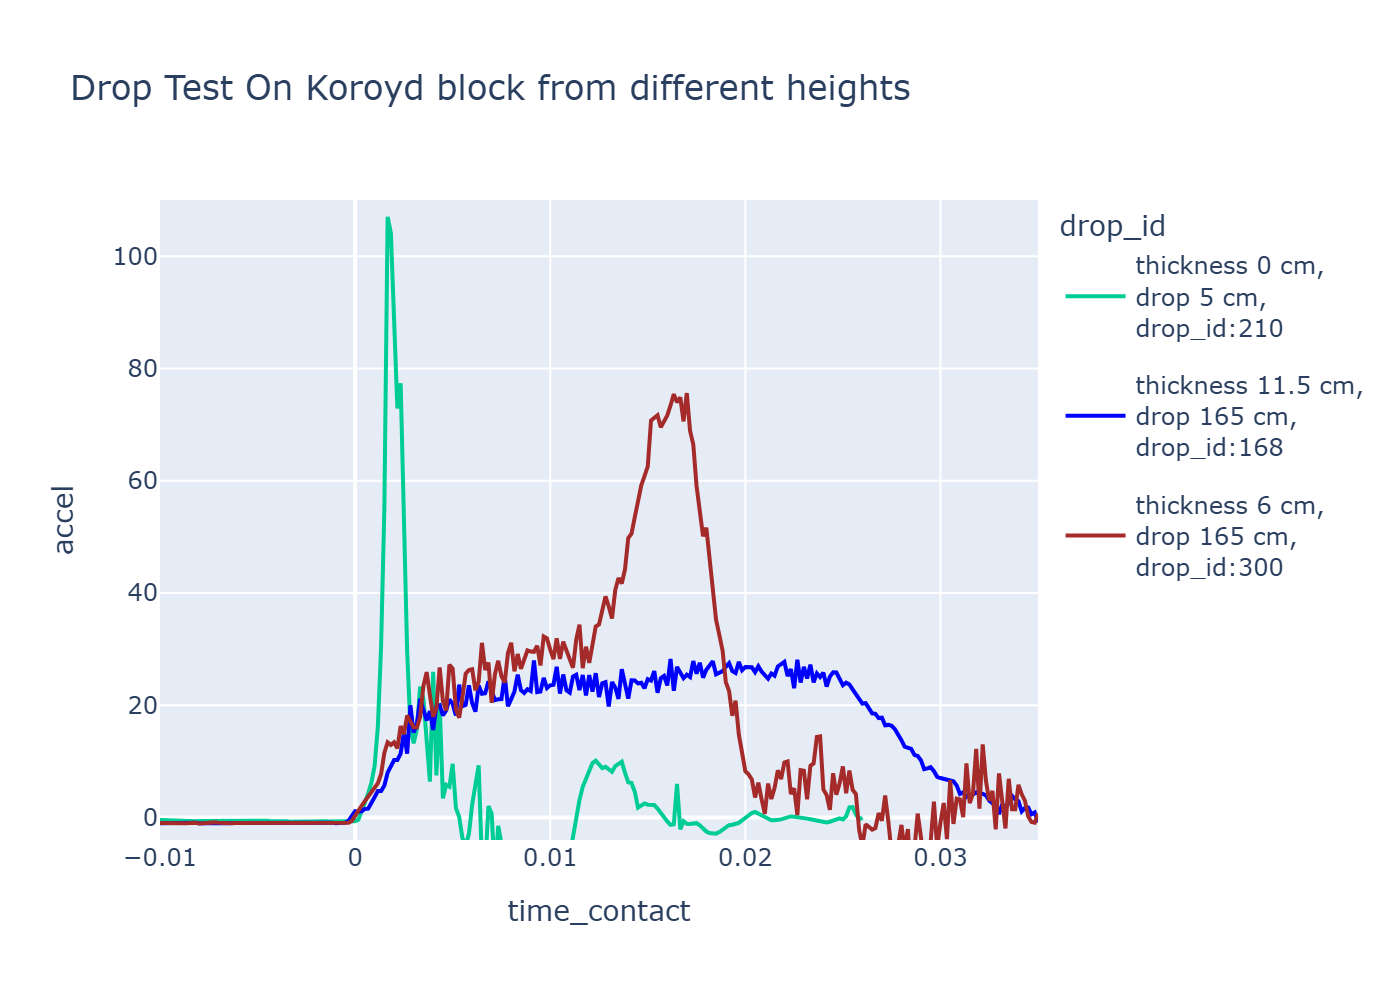
Comparison to Bare-ass 5cm Drop
The idea here is to compare the initial jerk with the bare drop done in this analysis:
Jerk Analysis Report
Interpretation
- The bare-ass drop first drop peak duration is similar to the ramp up duration of the Koroyd protectors,
while having max_g and max jerk much higher.
- It is difficult to consider the initial jerk of the 11.5 cm blue curve as dangerous, given that the 5 cm
bare drop (green curve) does not injure a human.
Inflatable Drop Height Comparison
Protocol
- The dummy is dropped naked on an inflatable protector (340mm X 250mm) with a thickness of 130mm. It is
was impossible to test thinner protector without bottoming out.
- Multiple drops were performed from different drop heights to characterize the inflatable protector
response.
- On some drops (see table below), the air valve opened during the impact, which reduced the acceleration
peak. Another tests shows a decrease of about 10-15% in max g when the valve opens during impact.
Drop Details for Inflatable
| Drop ID |
Block ID |
Drop Height (mm) |
Original Thickness (mm) |
Color |
Comment |
| 182 |
5 |
330 |
130 |
olive |
inflatable |
| 183 |
5 |
638 |
130 |
yellow |
inflatable |
| 184 |
5 |
936 |
130 |
magenta |
inflatable, valve opened |
| 186 |
5 |
1363 |
130 |
cyan |
inflatable |
| 301 |
5 |
1650 |
130 |
black |
inflatable, valve opened |
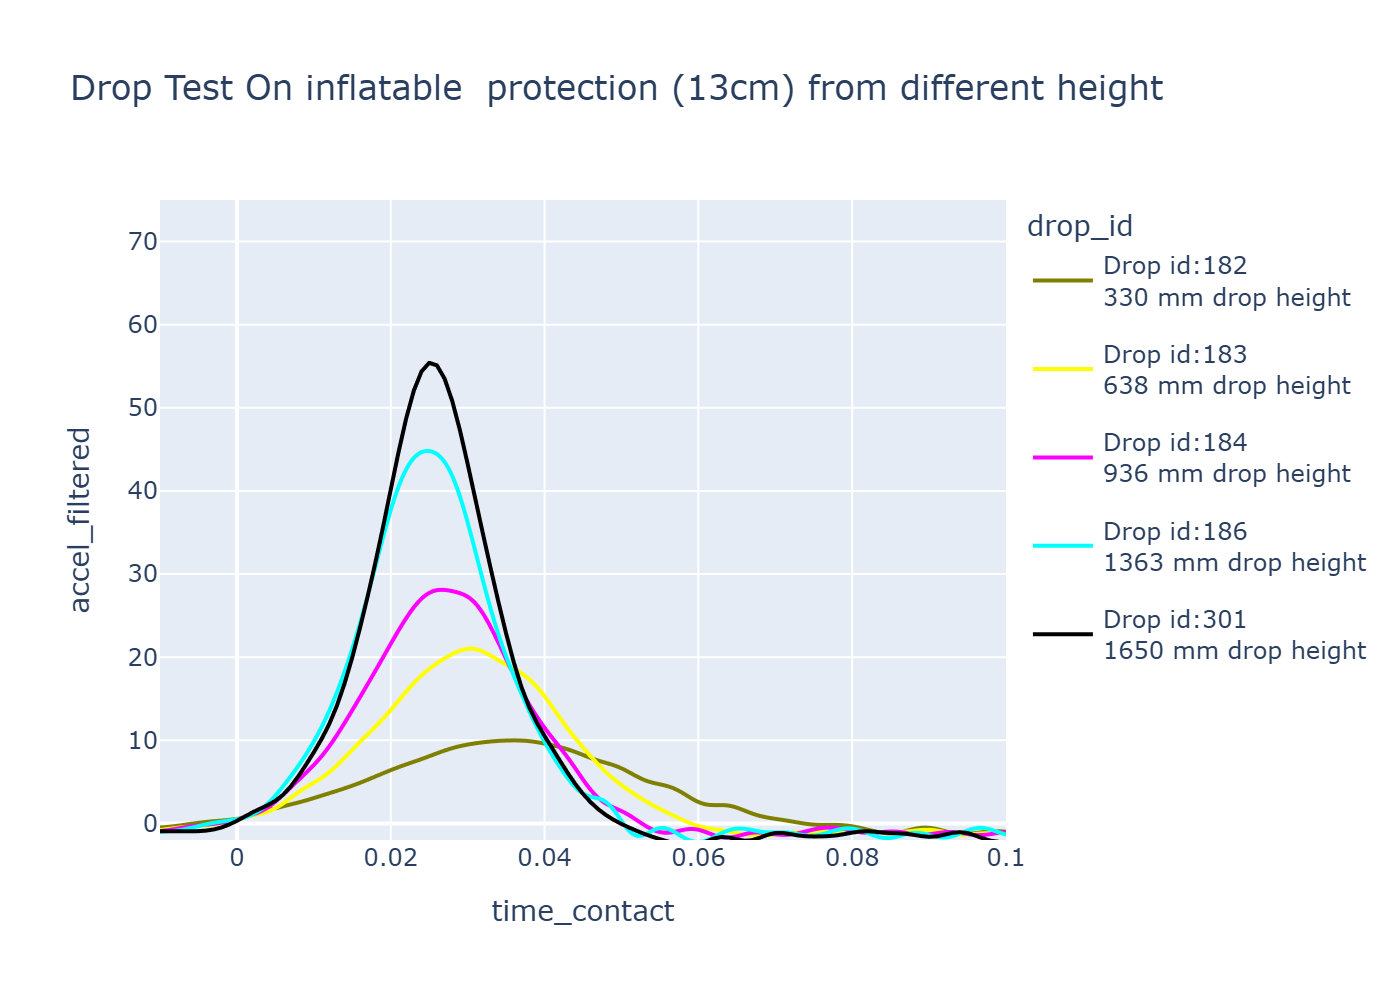
Acceleration Curves by Height
Numerical Results
|
0 |
1 |
2 |
3 |
4 |
| drop ID |
182 |
183 |
184 |
186 |
301 |
| Drop height (mm) |
330 |
638 |
936 |
1363 |
1650 |
| falling mass (kg) |
52.0 |
52.0 |
52.0 |
52.0 |
52.0 |
| max acceleration - filtered (g) |
29.28 |
39.61 |
48.65 |
58.73 |
68.55 |
| SIC |
35.11 |
66.24 |
94.73 |
128.77 |
156.33 |
| DRI |
12.47 |
18.35 |
21.98 |
26.22 |
29.68 |
| measured momentum (kg·m/s) |
175.06 |
244.04 |
296.37 |
358.67 |
398.39 |
| duration above 38 g (ms) |
0.0 |
1.729 |
7.044 |
13.834 |
18.629 |
| duration above 20 g (ms) |
15.835 |
29.134 |
38.725 |
46.909 |
53.472 |
| curve color |
olive |
yellow |
magenta |
cyan |
black |
Interpretation
- This inflatable protection shows an almost proportional response to the drop height.
- This particular protector does not pass the current EN certification requirements due to its limited
volume and small thickness but this is the best inflatable protector we could make for this given
inflated thickness.
- During this experiment valve shown to be an interesting features, by increasing the valve diameter on
this same protector the
final result can be optimized for the EN drop height and pass the EN test, at the expense of a reduced
margin before bottoming out.
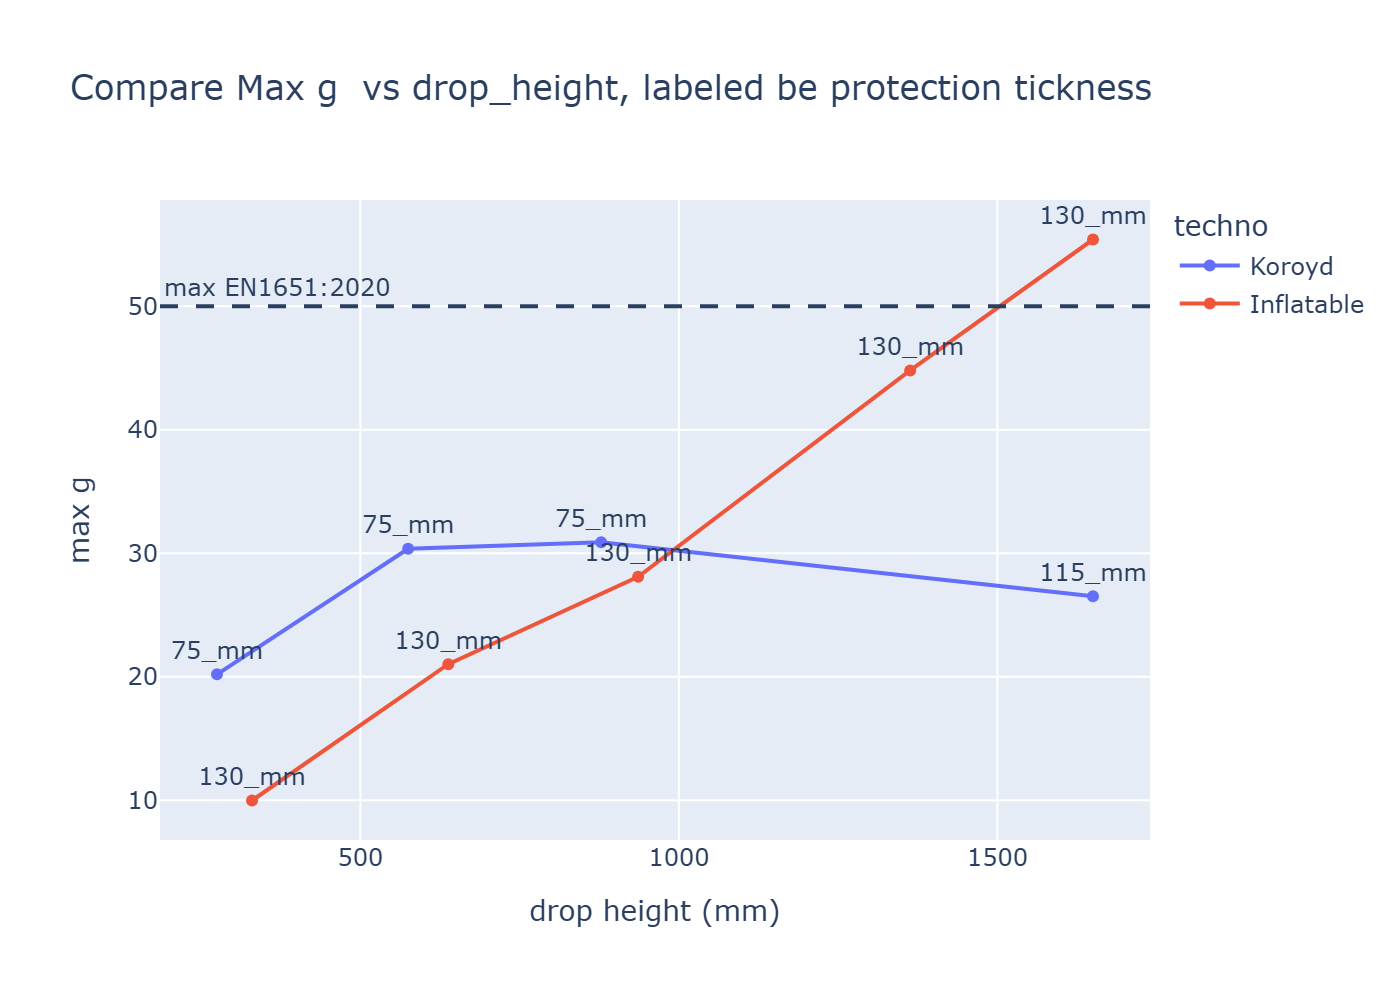
Honeycomb vs Inflatable Comparison
This comparison shows the maximum acceleration recorded versus drop height for both particular honeycomb and
inflatable
protectors,
labeled by protection thickness.
Analysis
- Koroyd behavior: Shows a plateau response across different drop heights with consistent
maximum acceleration around 30g. The acceleration is
relatively independent of drop height, demonstrating the honeycomb buckling behavior.
- Inflatable behavior: Shows a proportional increase in maximum acceleration with drop
height,
from ~10g at 330mm to ~68.5g at 1650mm.
Interpretation
- For drop heights below approximately 1 m, this particular honeycomb protector is less comfortable, and
the max g
remains nearly constant regardless of height.
- This particular inflatable protectors, although more comfortable for drops below 1 m, seem to present
higher risk at greater drop heights.
- Comfort from low height drop is not neccessarly representative to safety for higher drops.
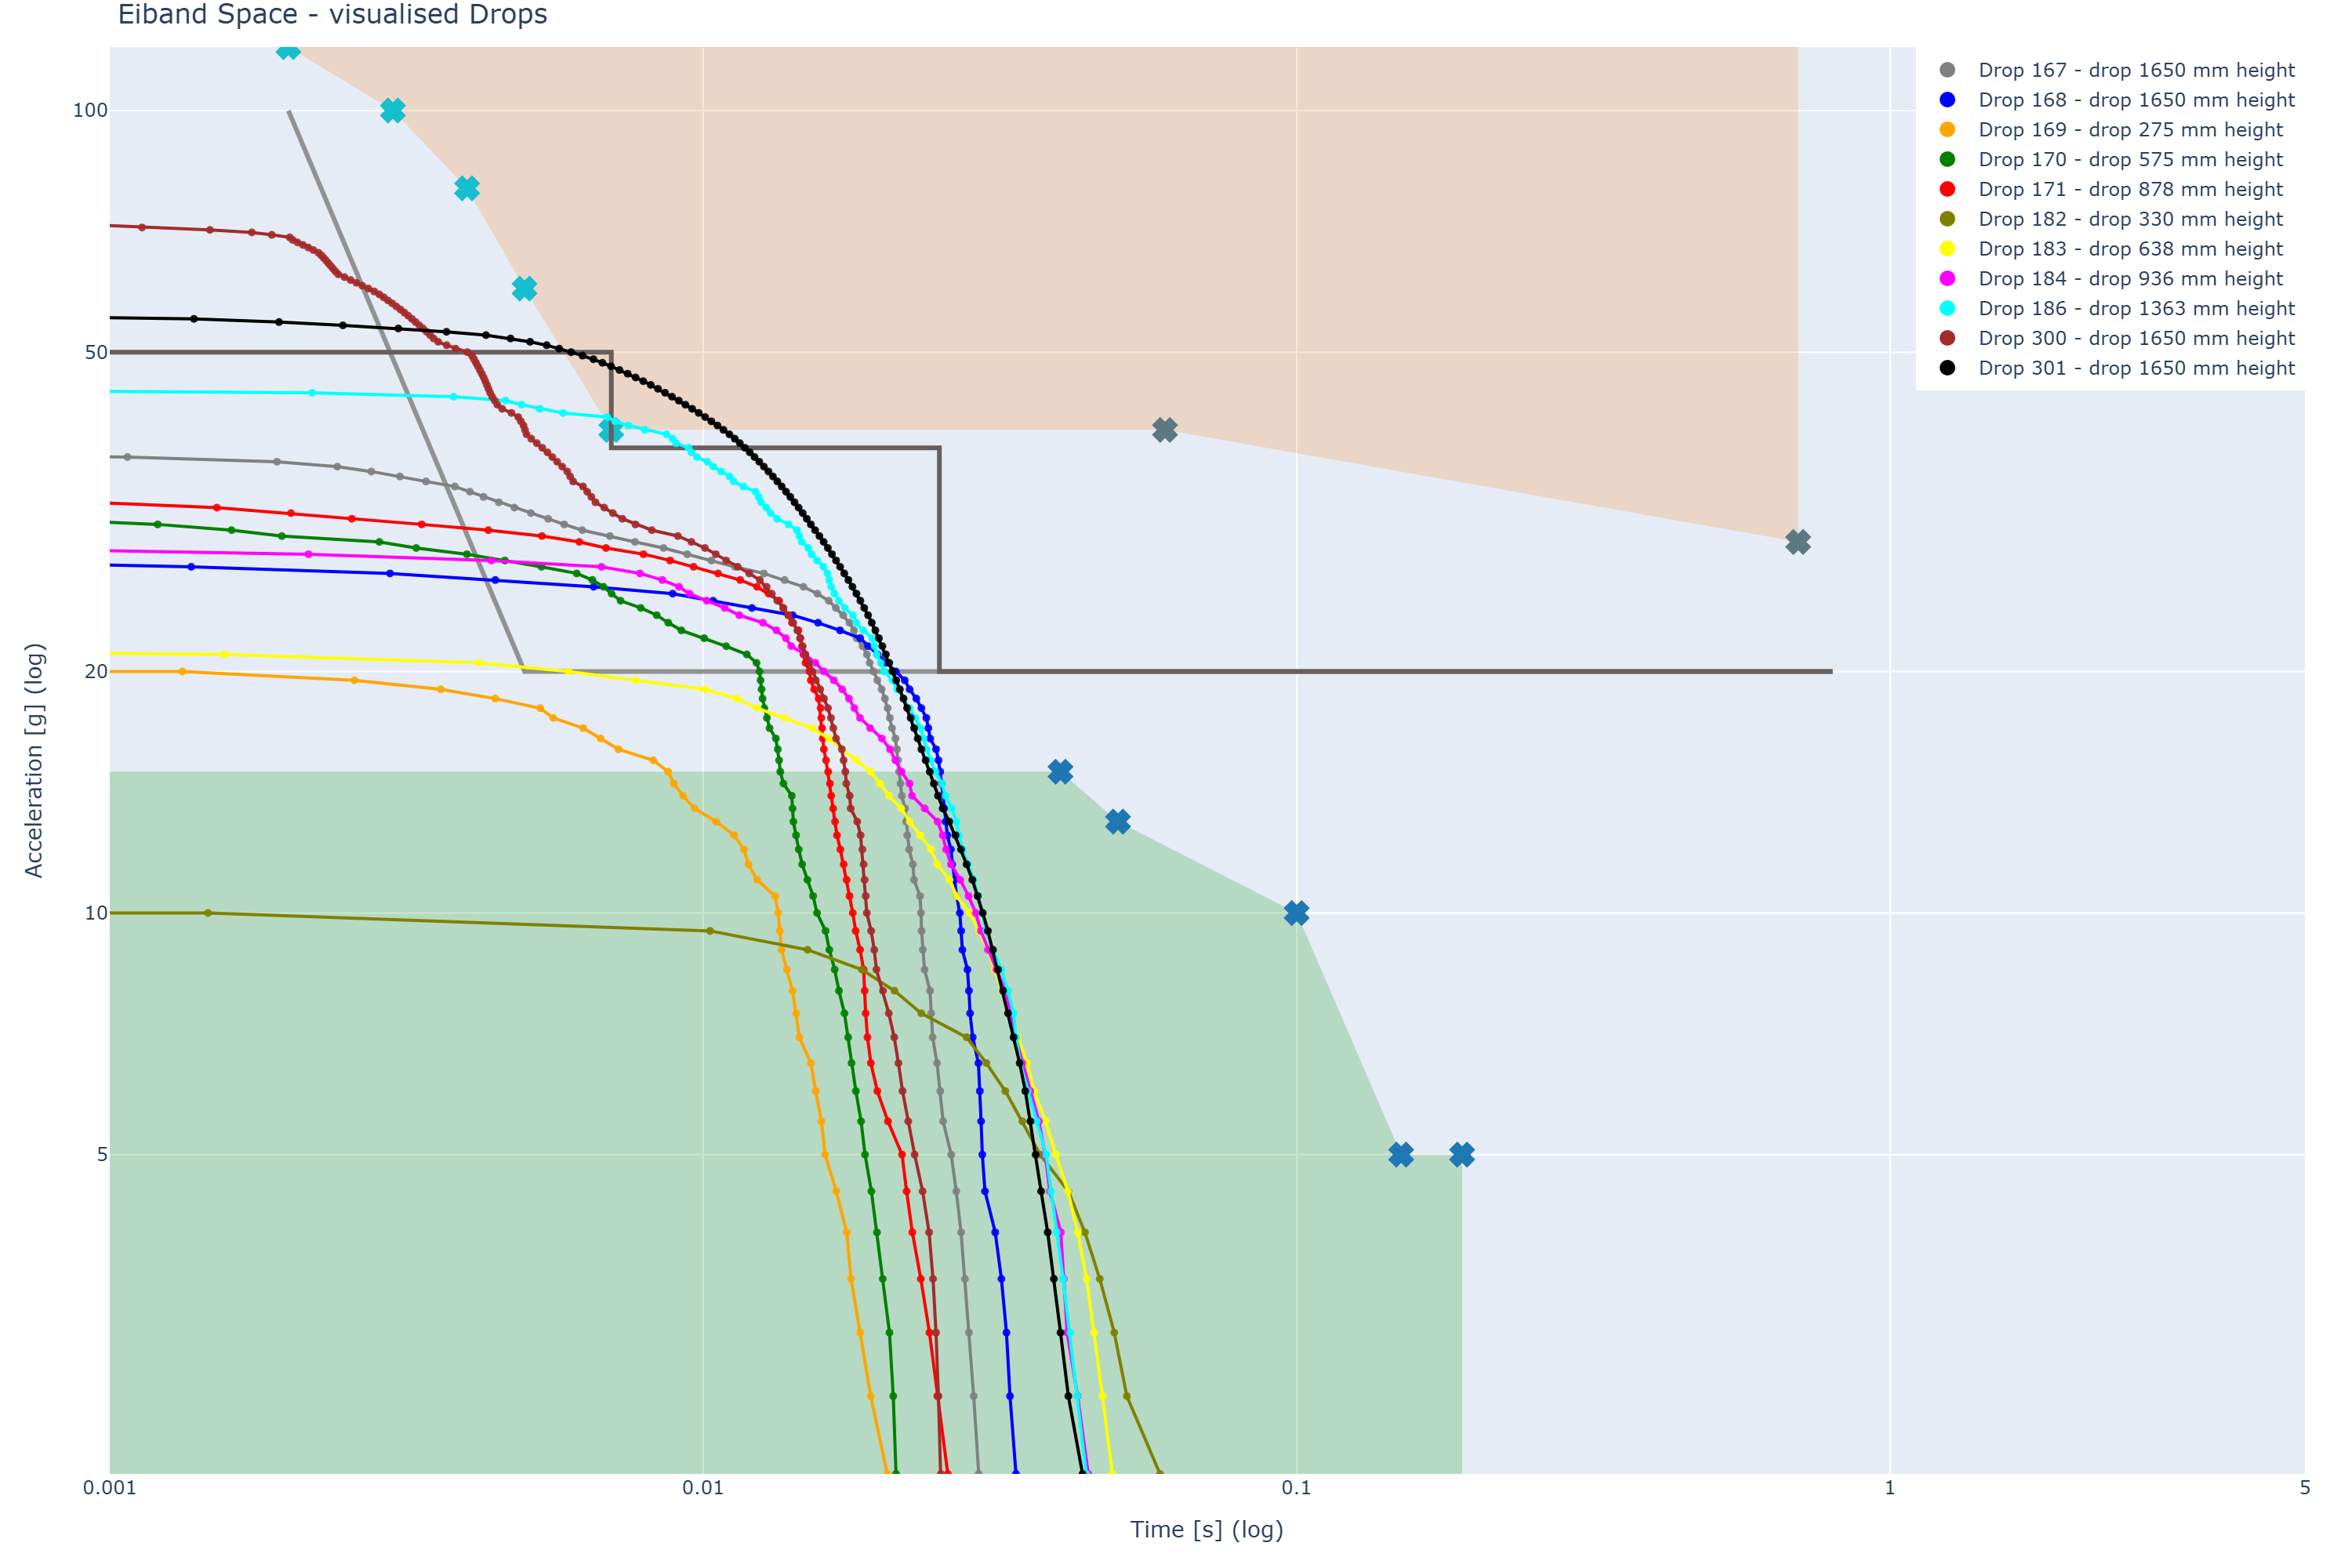
Eiband Space Representation
These drops plotted in the Eiband space.