
Fred Pieri, V1.1 / 15/11/2024
Edit: 18/11/2024 , typo
Edit: 02/12/2025 , adding more drops sample to download
All the information below is my view and my understanding as of today. I allow myself to update my position at any time based on new evidence, information, or facts.
This document is a reflexion to improve the paraglider back protector, it mainly explores the possible implementation of the jerk criterion .
- Based on Zsolt Ero's article published on 02/10/2024: The Future of Paragliding Harness
- As a work for the WG6 group, regarding the current revision of the EN-1651 (Paragliding harnesses requirements)
- The EN-1651 standard is based on the assumption that the role of the protection is to prevent spine compression damage, during a rescue landing.
The following goals should be kept in mind during the analysis:
Measuring jerk directly from raw acceleration data poses challenges because differentiating the acceleration amplifies noise, making the jerk measurement unreliable. Even minor noise fluctuations in acceleration can become exaggerated in the jerk calculation, resulting in a "noisy" jerk signal that fails to accurately represent actual changes.
Consider a theoretical example where the signal is constructed with the following characteristics:
The jerk is calculated as the slope of the acceleration curve at a specific point:
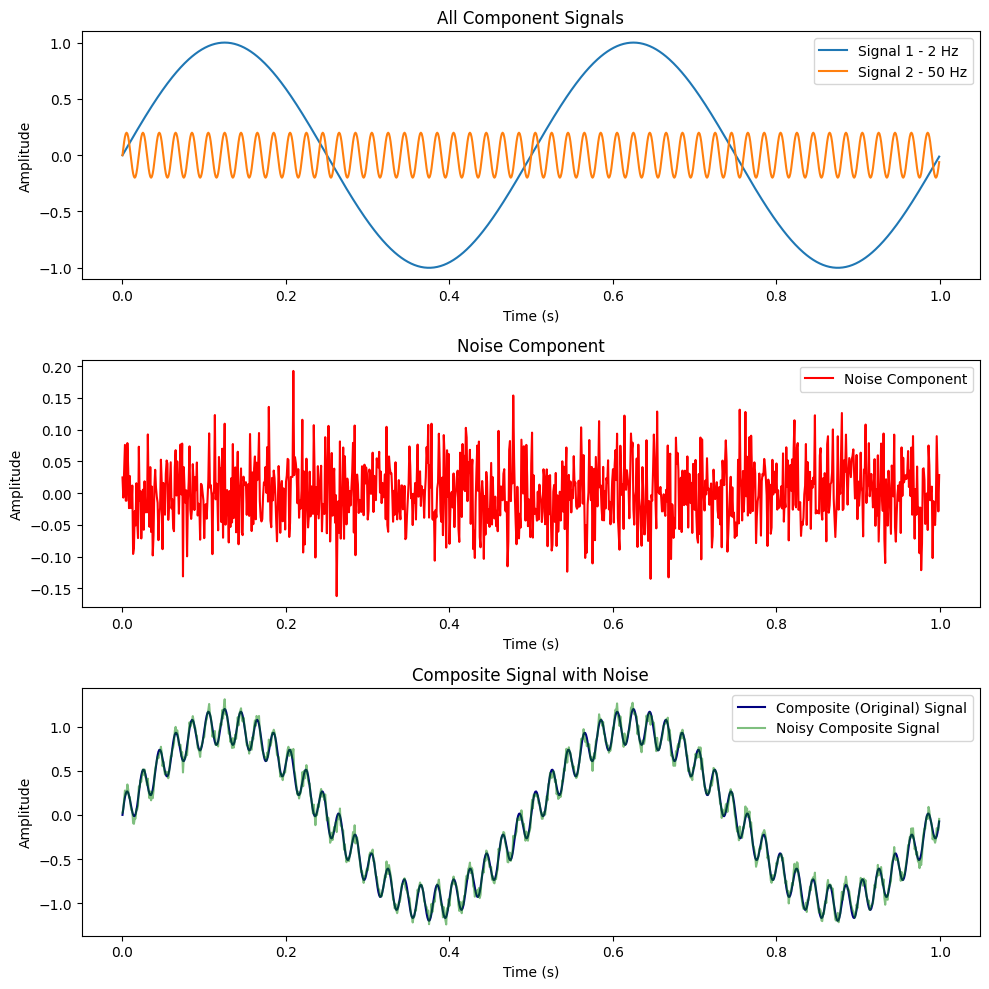
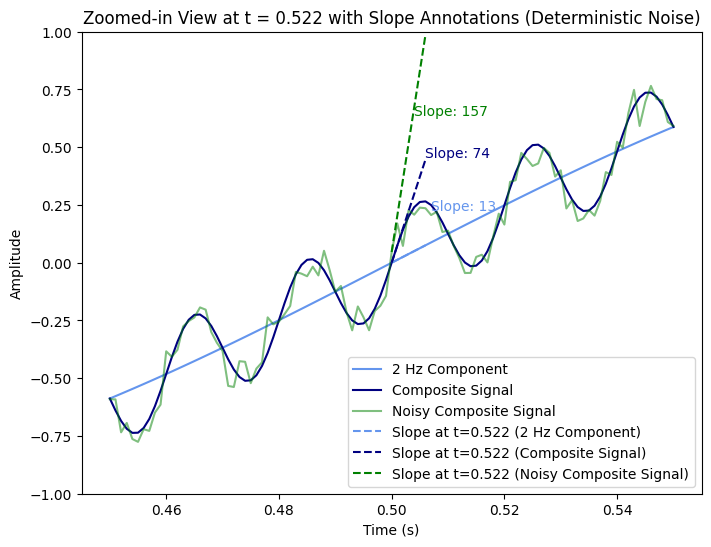
It is evident that the core signal at 2 Hz has a jerk value of 13, while the other signals exhibit significantly higher jerk values (74 for the combined signal and 157 for the combined signal with added noise).
Here is the signal and its derivative:
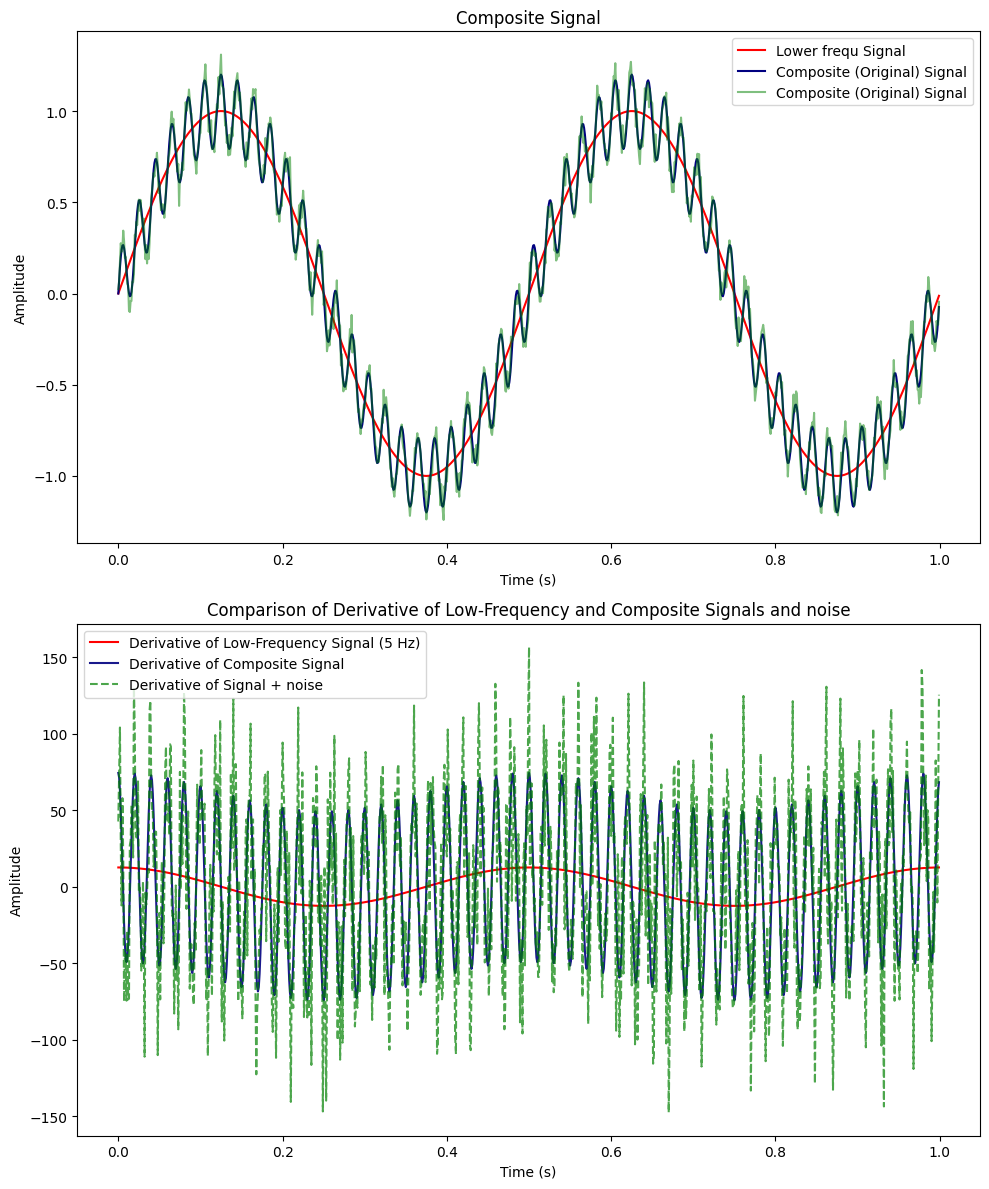
Maximum Values of Signal Derivatives:
For an instantaneous jerk of 12.6 for the base signal, the value increases to 157 when accounting for the added noise.
Below is the data from a drop test of a HALO harness prototype, measured at the Ozone Office:
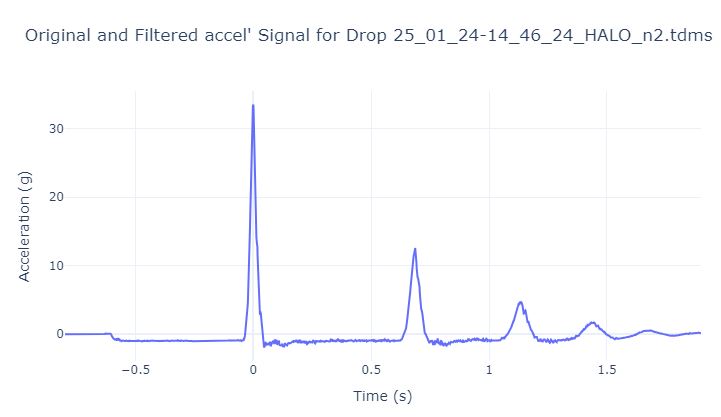
Click for live graph , below zoom on the first impact
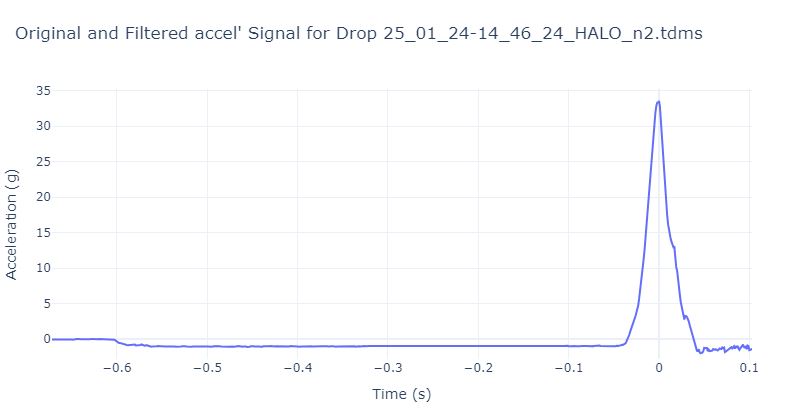
Although the noise is less significant than in our theoretical example, let’s examine what this means in terms of repeatability on several drops on several harnesses.
Protocol:
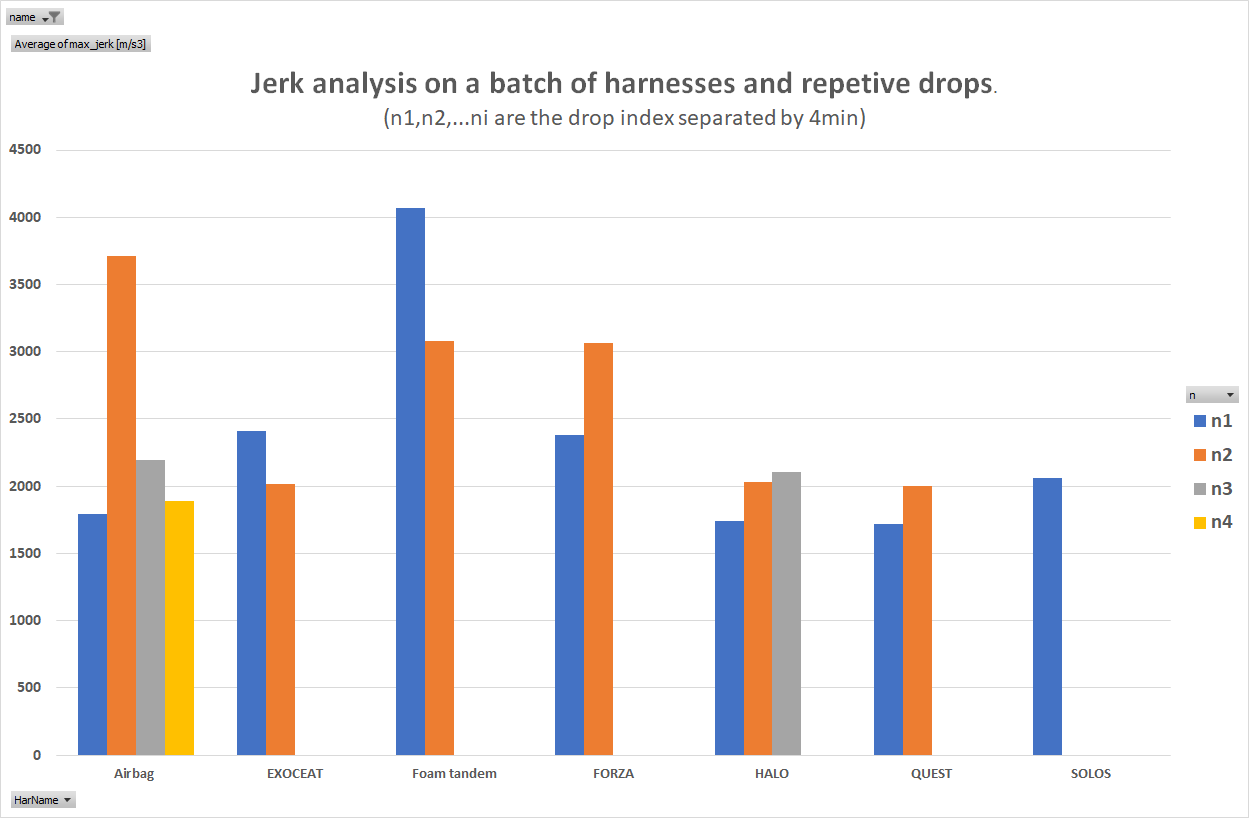
Clearly, the repeatability is not sufficient.
To address this issue, we can consider several approaches:
We can immediately set this idea aside, as the derivative introduces large spikes or can even approach infinity at points of rapid change due to noise. This significantly distorts the average and leads to misleading results.
While mathematically more accurate, the rolling average on acceleration also has its limitations. The effect of a rolling average depends on two factors:
Given these parameters, the rolling average can be understood as a low-pass filter with the following response (a 'SINC' curve):
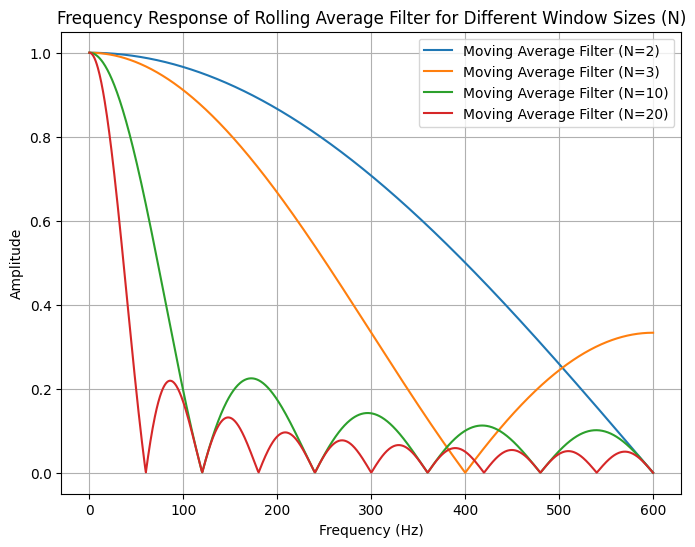
The response of a rolling average is not satisfactory as it requires adjusting its parameter (window size) for different test setups, and it also assumes a constant sampling rate. A better approach would be to use a low-pass filter.
My expertise in signal filtering is limited, so I rely on a classic Butterworth filter.
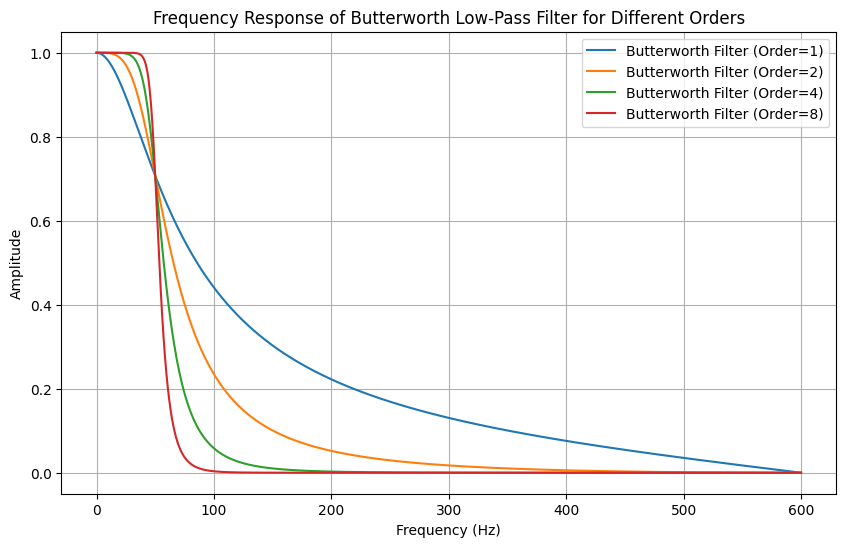
The Butterworth filter is preferred over a moving average filter because of its smooth frequency response, sharper roll-off, and flexibility in controlling cutoff frequencies. Unlike the moving average filter, which has an oscillatory response and less effective attenuation, the Butterworth filter provides a predictable, flat passband and can be configured to minimize phase distortion.
Below is the response of a Butterworth filter with a cutoff frequency of 50 Hz for different filter orders:
This is the concrete HALO drop data passed through a Butterworth filter with a cutoff frequency of 50 Hz and an order of 8:
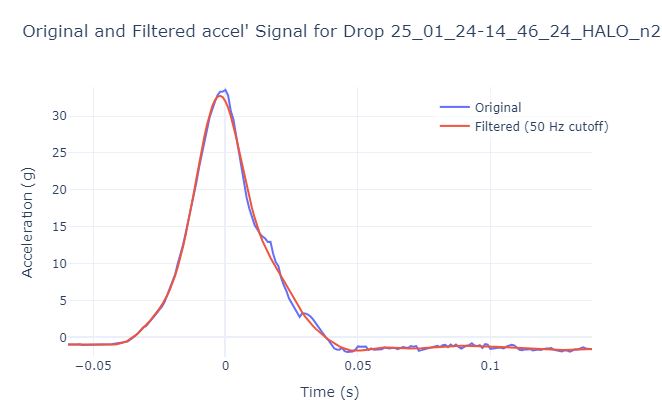
Although the noise has been reduced, the filtering has also affected the maximum peak.
For example: Measure the jerk over a rolling time window of 0.01 seconds.
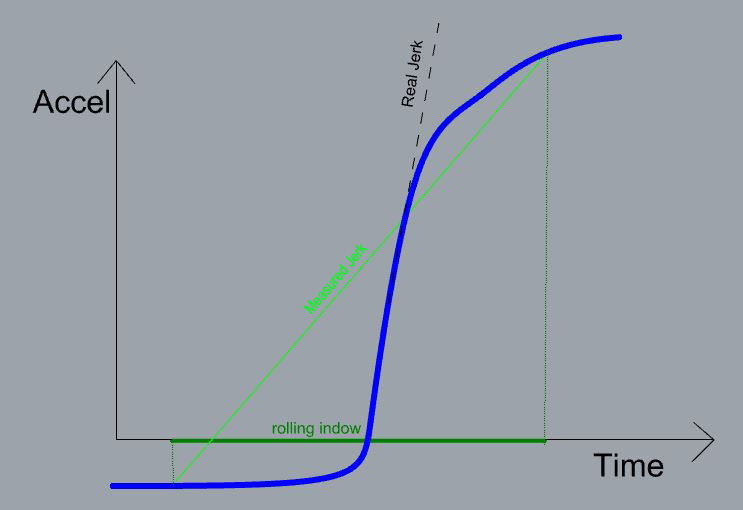
Any time criterion should be chosen carefully. If the window is too wide, it will not catch high jerk values, and if it is too narrow, it will be overly influenced by noise. Below is a schematic representation of a window that is too wide:
This criterion can be absolute or relative to the maximum g peak:
For both scenarios, situations may arise where the criterion is not adequate:
While the Jerk criterion is documented and seems an interesting approach, it opens some questions and challenges :
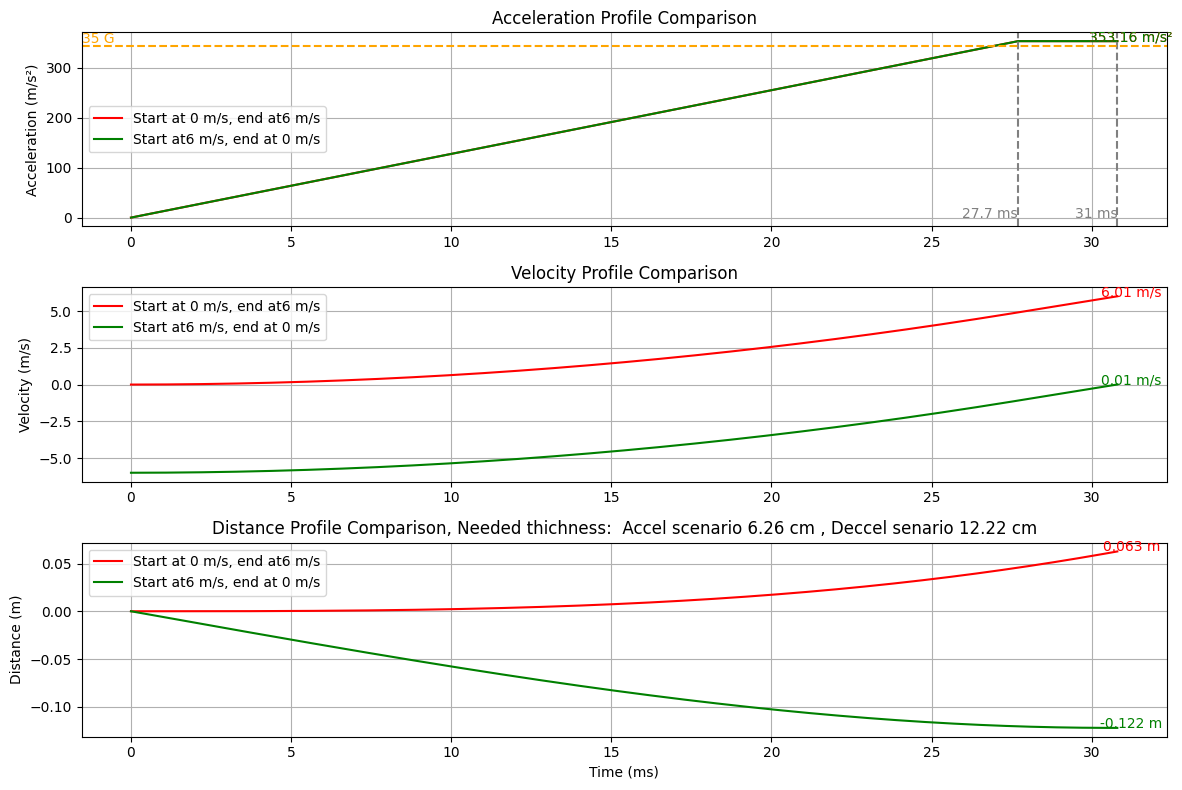
In a previous post by Zsolt, a theoretical minimum thickness of 6.22 cm was calculated based on the following criteria:
Using the same criteria, we recalculated a absolute minimum thickness of 12.2 cm.
Based on Zsolt's assumption of an additional 20% for uncompressed material, the minimun thickness of a protection would be approximately 15 cm. However, it is worth noting that, in practice, foam protectors tend to compress by around 70% so an extra thickness of 30% is more realistic.
Below is a graph showing both scenarios, with the green
line representing the scenario that should be considered, starting from acceleration to distance (protection
thickness) via integrations. The red line is the incorrect
calculation.
Here the Colab (python) document with the code for peer review:
https://colab.research.google.com/drive/1iWp5Yp-w_7bZsqWLbQBKYxp_N3ADR-8k?usp=sharing
Absolute measurement criteria (e.g., deformation limited to 10 cm) are not ideal for the following reasons:
These issues highlight that absolute dimensional criteria may lack the robustness and adaptability needed for a meaningful evaluation of protective systems. Below some cad design that illustrate the different problematic:
The challenge is to give the thickness of these protections:
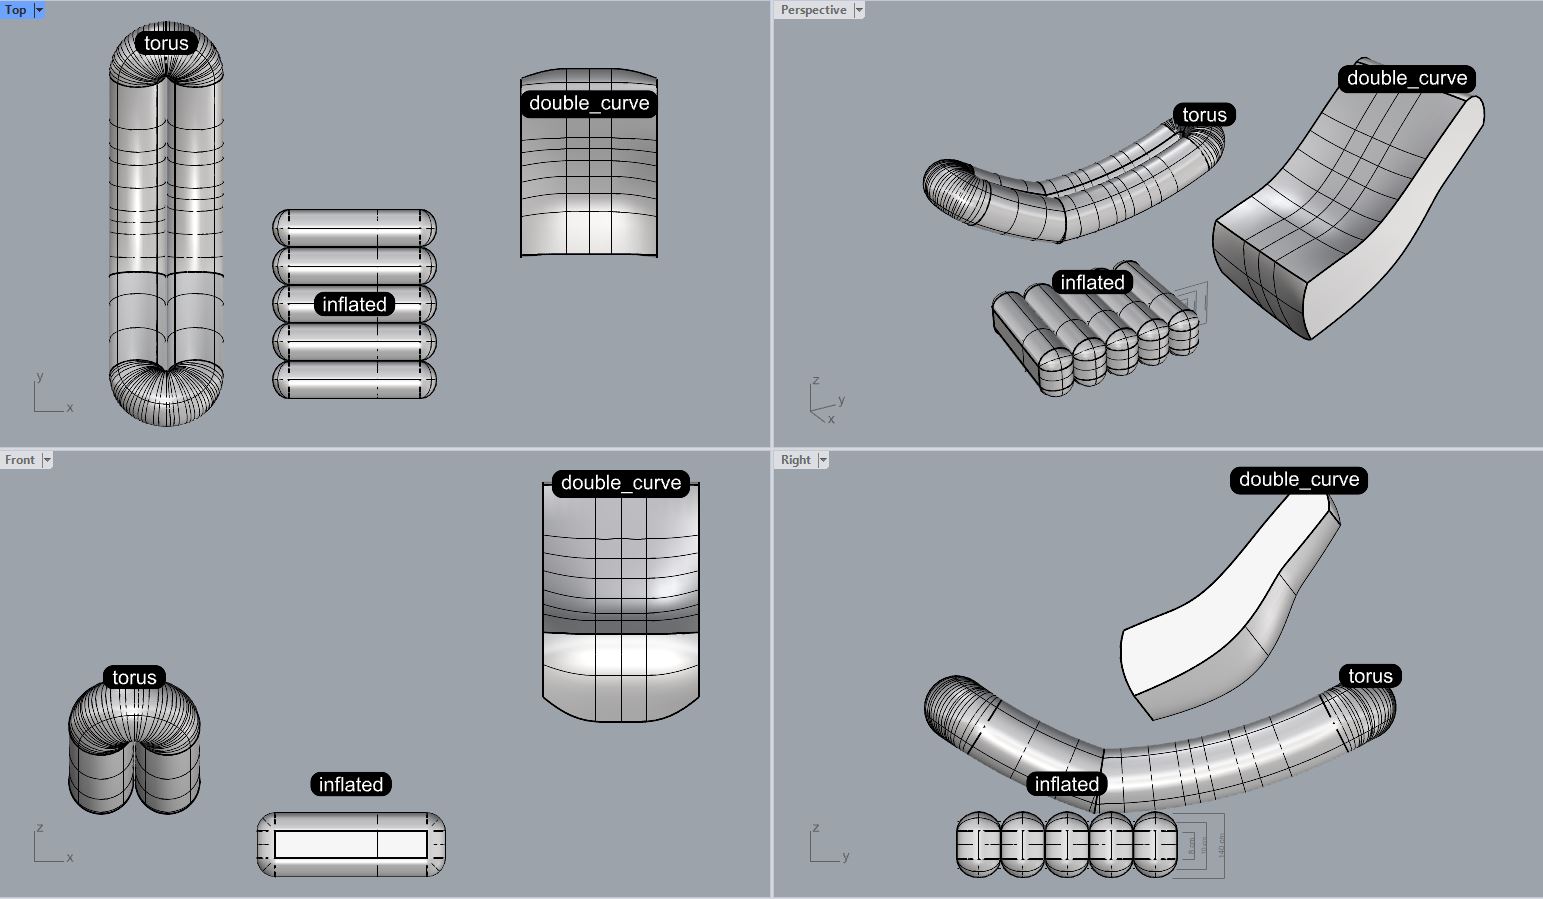
The cad drawing (format STEP) can be downloaded here:
See below a acceleration curve during an 'impact' :
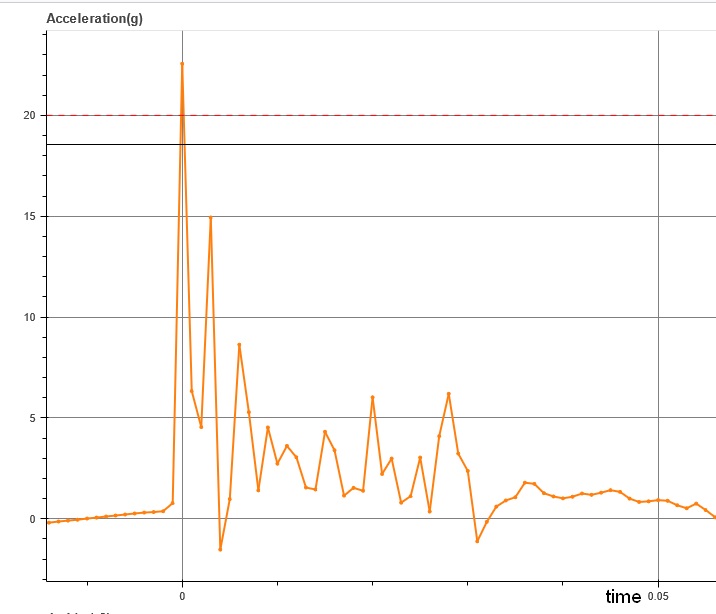
This impact was max peak of 22 g with a jerk around 20 000 g/s
below a video of this 'impact' :
My fingers and my hand were not broken or injured during this experience. :-) This example illustrates that a number of Jerk alone or a number of G alone does not allow conclusions about the danger to humans.
Here some real data to download from 3 drops done at the Ozone's lab on the same harness, drop spaced by around 2-4min :
I’m sharing this dataset because I believe working with real data is the best way to learn and make
progress. Open data and peer review help us grow together.
We should keep in mind this is just a small sample :one harness, one lab, one set of conditions, etc...
Let’s keep any conclusions modest.